Cities with the Highest Percentage of Population Employed in Management in Minnesota
RELATED REPORTS & OPTIONS
Management
Minnesota
Compare Cities
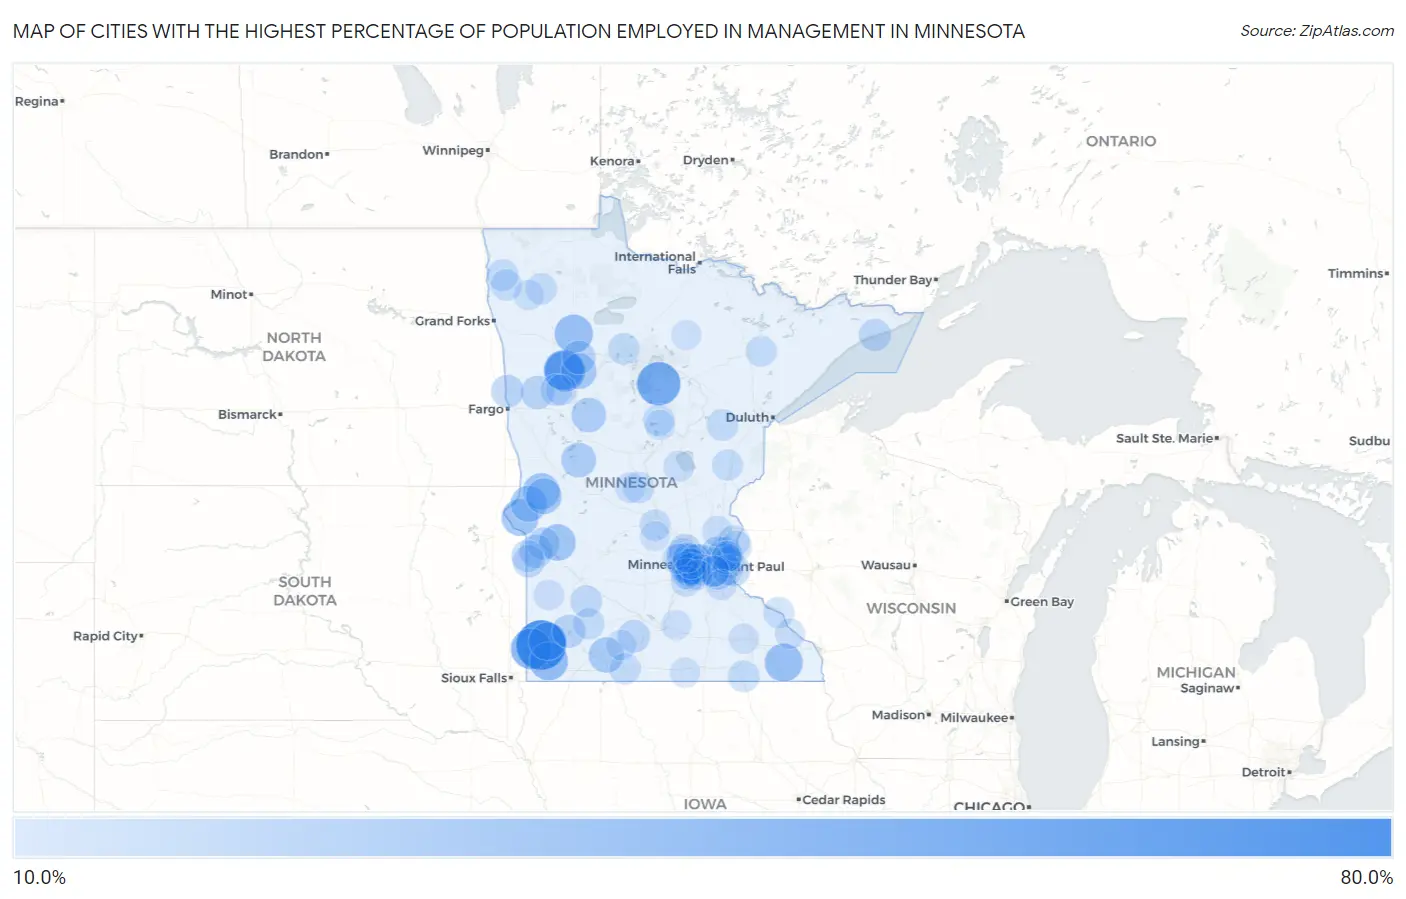
Map of Cities with the Highest Percentage of Population Employed in Management in Minnesota
0.0%
80.0%
Cities with the Highest Percentage of Population Employed in Management in Minnesota
| City | % Employed | vs State | vs National | |
| 1. | Hatfield | 66.7% | 11.5%(+55.1)#1 | 11.0%(+55.6)#115 |
| 2. | Boy River | 50.0% | 11.5%(+38.5)#2 | 11.0%(+39.0)#261 |
| 3. | Ihlen | 43.5% | 11.5%(+31.9)#3 | 11.0%(+32.5)#357 |
| 4. | Midway | 42.9% | 11.5%(+31.3)#4 | 11.0%(+31.8)#371 |
| 5. | Beaulieu | 40.9% | 11.5%(+29.4)#5 | 11.0%(+29.9)#416 |
| 6. | Kenneth | 37.5% | 11.5%(+26.0)#6 | 11.0%(+26.5)#504 |
| 7. | Gully | 36.7% | 11.5%(+25.1)#7 | 11.0%(+25.6)#539 |
| 8. | Whalan | 36.1% | 11.5%(+24.6)#8 | 11.0%(+25.1)#561 |
| 9. | Woodstock | 35.4% | 11.5%(+23.8)#9 | 11.0%(+24.3)#596 |
| 10. | Barry | 33.3% | 11.5%(+21.8)#10 | 11.0%(+22.3)#696 |
| 11. | Medicine Lake | 32.6% | 11.5%(+21.0)#11 | 11.0%(+21.6)#740 |
| 12. | Holloway | 32.5% | 11.5%(+21.0)#12 | 11.0%(+21.5)#744 |
| 13. | Norcross | 32.0% | 11.5%(+20.5)#13 | 11.0%(+21.0)#771 |
| 14. | Dumont | 31.9% | 11.5%(+20.4)#14 | 11.0%(+20.9)#776 |
| 15. | Herman | 30.6% | 11.5%(+19.1)#15 | 11.0%(+19.6)#858 |
| 16. | Roy Lake | 30.0% | 11.5%(+18.5)#16 | 11.0%(+19.0)#906 |
| 17. | Woodland | 29.5% | 11.5%(+17.9)#17 | 11.0%(+18.4)#941 |
| 18. | Fish Lake | 29.4% | 11.5%(+17.9)#18 | 11.0%(+18.4)#949 |
| 19. | Deephaven | 28.9% | 11.5%(+17.4)#19 | 11.0%(+17.9)#987 |
| 20. | Minnetonka Beach | 28.7% | 11.5%(+17.2)#20 | 11.0%(+17.7)#998 |
| 21. | Vining | 27.8% | 11.5%(+16.2)#21 | 11.0%(+16.8)#1,115 |
| 22. | Wolf Lake | 27.7% | 11.5%(+16.1)#22 | 11.0%(+16.6)#1,125 |
| 23. | Orono | 27.5% | 11.5%(+15.9)#23 | 11.0%(+16.4)#1,142 |
| 24. | Sunfish Lake | 26.7% | 11.5%(+15.2)#24 | 11.0%(+15.7)#1,239 |
| 25. | North Oaks | 26.5% | 11.5%(+15.0)#25 | 11.0%(+15.5)#1,267 |
| 26. | Tonka Bay | 25.6% | 11.5%(+14.1)#26 | 11.0%(+14.6)#1,398 |
| 27. | Ebro | 25.0% | 11.5%(+13.5)#27 | 11.0%(+14.0)#1,505 |
| 28. | Dellwood | 24.9% | 11.5%(+13.4)#28 | 11.0%(+13.9)#1,540 |
| 29. | Wayzata | 24.6% | 11.5%(+13.0)#29 | 11.0%(+13.5)#1,591 |
| 30. | Ulen | 24.4% | 11.5%(+12.9)#30 | 11.0%(+13.4)#1,618 |
| 31. | Bellingham | 24.4% | 11.5%(+12.8)#31 | 11.0%(+13.3)#1,631 |
| 32. | The Lakes | 23.9% | 11.5%(+12.3)#32 | 11.0%(+12.9)#1,730 |
| 33. | Independence | 23.5% | 11.5%(+11.9)#33 | 11.0%(+12.4)#1,818 |
| 34. | Georgetown | 23.1% | 11.5%(+11.5)#34 | 11.0%(+12.1)#1,908 |
| 35. | Medina | 23.0% | 11.5%(+11.5)#35 | 11.0%(+12.0)#1,915 |
| 36. | Lilydale | 22.8% | 11.5%(+11.3)#36 | 11.0%(+11.8)#1,950 |
| 37. | La Salle | 22.4% | 11.5%(+10.9)#37 | 11.0%(+11.4)#2,037 |
| 38. | Afton | 22.4% | 11.5%(+10.9)#38 | 11.0%(+11.4)#2,044 |
| 39. | Correll | 22.2% | 11.5%(+10.7)#39 | 11.0%(+11.2)#2,086 |
| 40. | Hanover | 21.9% | 11.5%(+10.3)#40 | 11.0%(+10.9)#2,165 |
| 41. | Marietta | 21.8% | 11.5%(+10.3)#41 | 11.0%(+10.8)#2,183 |
| 42. | Grand Marais | 21.7% | 11.5%(+10.2)#42 | 11.0%(+10.7)#2,207 |
| 43. | Willernie | 21.6% | 11.5%(+10.1)#43 | 11.0%(+10.6)#2,238 |
| 44. | Shorewood | 21.5% | 11.5%(+9.97)#44 | 11.0%(+10.5)#2,262 |
| 45. | Nassau | 21.1% | 11.5%(+9.51)#45 | 11.0%(+10.0)#2,407 |
| 46. | Essig | 20.5% | 11.5%(+8.91)#46 | 11.0%(+9.43)#2,594 |
| 47. | Ogema | 20.3% | 11.5%(+8.79)#47 | 11.0%(+9.32)#2,626 |
| 48. | Vesta | 20.3% | 11.5%(+8.73)#48 | 11.0%(+9.26)#2,648 |
| 49. | Gem Lake | 20.1% | 11.5%(+8.54)#49 | 11.0%(+9.06)#2,708 |
| 50. | Mendota | 20.0% | 11.5%(+8.45)#50 | 11.0%(+8.98)#2,748 |
| 51. | Wright | 20.0% | 11.5%(+8.45)#51 | 11.0%(+8.98)#2,756 |
| 52. | Turtle River | 20.0% | 11.5%(+8.45)#52 | 11.0%(+8.98)#2,763 |
| 53. | Revere | 20.0% | 11.5%(+8.45)#53 | 11.0%(+8.98)#2,766 |
| 54. | Taopi | 20.0% | 11.5%(+8.45)#54 | 11.0%(+8.98)#2,768 |
| 55. | Manhattan Beach | 20.0% | 11.5%(+8.45)#55 | 11.0%(+8.98)#2,776 |
| 56. | Sobieski | 19.8% | 11.5%(+8.27)#56 | 11.0%(+8.79)#2,832 |
| 57. | Greenfield | 19.7% | 11.5%(+8.17)#57 | 11.0%(+8.70)#2,860 |
| 58. | Stephen | 19.7% | 11.5%(+8.13)#58 | 11.0%(+8.66)#2,875 |
| 59. | Lake Elmo | 19.6% | 11.5%(+8.05)#59 | 11.0%(+8.58)#2,900 |
| 60. | Chanhassen | 19.5% | 11.5%(+8.00)#60 | 11.0%(+8.53)#2,920 |
| 61. | Argyle | 19.5% | 11.5%(+7.97)#61 | 11.0%(+8.50)#2,929 |
| 62. | Scandia | 19.5% | 11.5%(+7.97)#62 | 11.0%(+8.50)#2,930 |
| 63. | Mound | 19.5% | 11.5%(+7.92)#63 | 11.0%(+8.44)#2,950 |
| 64. | Plymouth | 19.4% | 11.5%(+7.85)#64 | 11.0%(+8.37)#2,984 |
| 65. | Greenwood | 19.3% | 11.5%(+7.77)#65 | 11.0%(+8.30)#3,017 |
| 66. | Holt | 19.2% | 11.5%(+7.68)#66 | 11.0%(+8.21)#3,055 |
| 67. | Sherburn | 19.2% | 11.5%(+7.63)#67 | 11.0%(+8.16)#3,075 |
| 68. | St Augusta | 19.0% | 11.5%(+7.42)#68 | 11.0%(+7.95)#3,151 |
| 69. | Finlayson | 18.8% | 11.5%(+7.29)#69 | 11.0%(+7.82)#3,203 |
| 70. | Pine Springs | 18.8% | 11.5%(+7.24)#70 | 11.0%(+7.76)#3,225 |
| 71. | Edina | 18.7% | 11.5%(+7.19)#71 | 11.0%(+7.71)#3,249 |
| 72. | Biwabik | 18.6% | 11.5%(+7.06)#72 | 11.0%(+7.58)#3,305 |
| 73. | Wabasha | 18.6% | 11.5%(+7.03)#73 | 11.0%(+7.55)#3,324 |
| 74. | Carver | 18.5% | 11.5%(+6.94)#74 | 11.0%(+7.47)#3,356 |
| 75. | White Earth | 18.4% | 11.5%(+6.90)#75 | 11.0%(+7.43)#3,376 |
| 76. | Woodbury | 18.4% | 11.5%(+6.85)#76 | 11.0%(+7.38)#3,409 |
| 77. | Martin Lake | 18.4% | 11.5%(+6.84)#77 | 11.0%(+7.36)#3,420 |
| 78. | Mendota Heights | 18.3% | 11.5%(+6.80)#78 | 11.0%(+7.33)#3,440 |
| 79. | Vineland | 18.3% | 11.5%(+6.80)#79 | 11.0%(+7.32)#3,443 |
| 80. | Marine On St Croix | 18.3% | 11.5%(+6.79)#80 | 11.0%(+7.31)#3,449 |
| 81. | Pickwick | 18.0% | 11.5%(+6.49)#81 | 11.0%(+7.01)#3,610 |
| 82. | Victoria | 18.0% | 11.5%(+6.42)#82 | 11.0%(+6.95)#3,628 |
| 83. | Grant | 17.7% | 11.5%(+6.14)#83 | 11.0%(+6.67)#3,789 |
| 84. | Credit River | 17.6% | 11.5%(+6.04)#84 | 11.0%(+6.57)#3,845 |
| 85. | Coates | 17.6% | 11.5%(+6.02)#85 | 11.0%(+6.55)#3,858 |
| 86. | Swanville | 17.5% | 11.5%(+6.00)#86 | 11.0%(+6.52)#3,871 |
| 87. | Taunton | 17.5% | 11.5%(+6.00)#87 | 11.0%(+6.52)#3,872 |
| 88. | Butterfield | 17.3% | 11.5%(+5.77)#88 | 11.0%(+6.30)#4,000 |
| 89. | Rollingstone | 17.1% | 11.5%(+5.51)#89 | 11.0%(+6.04)#4,162 |
| 90. | Delano | 17.0% | 11.5%(+5.48)#90 | 11.0%(+6.01)#4,172 |
| 91. | Viking | 17.0% | 11.5%(+5.47)#91 | 11.0%(+6.00)#4,179 |
| 92. | Eden Prairie | 16.9% | 11.5%(+5.33)#92 | 11.0%(+5.85)#4,258 |
| 93. | Byron | 16.9% | 11.5%(+5.31)#93 | 11.0%(+5.84)#4,268 |
| 94. | Long Lake | 16.8% | 11.5%(+5.25)#94 | 11.0%(+5.78)#4,298 |
| 95. | Walters | 16.7% | 11.5%(+5.12)#95 | 11.0%(+5.65)#4,402 |
| 96. | Fairhaven | 16.5% | 11.5%(+5.00)#96 | 11.0%(+5.53)#4,474 |
| 97. | Madison Lake | 16.5% | 11.5%(+4.97)#97 | 11.0%(+5.50)#4,491 |
| 98. | Loretto | 16.5% | 11.5%(+4.94)#98 | 11.0%(+5.47)#4,505 |
| 99. | Crosslake | 16.5% | 11.5%(+4.94)#99 | 11.0%(+5.46)#4,507 |
| 100. | Bigfork | 16.5% | 11.5%(+4.94)#100 | 11.0%(+5.46)#4,509 |
Common Questions
What are the Top 10 Cities with the Highest Percentage of Population Employed in Management in Minnesota?
Top 10 Cities with the Highest Percentage of Population Employed in Management in Minnesota are:
What city has the Highest Percentage of Population Employed in Management in Minnesota?
Hatfield has the Highest Percentage of Population Employed in Management in Minnesota with 66.7%.
What is the Percentage of Population Employed in Management in the State of Minnesota?
Percentage of Population Employed in Management in Minnesota is 11.5%.
What is the Percentage of Population Employed in Management in the United States?
Percentage of Population Employed in Management in the United States is 11.0%.