Cities with the Most Immigrants from Africa in New Mexico
RELATED REPORTS & OPTIONS
Africa
New Mexico
Compare Cities
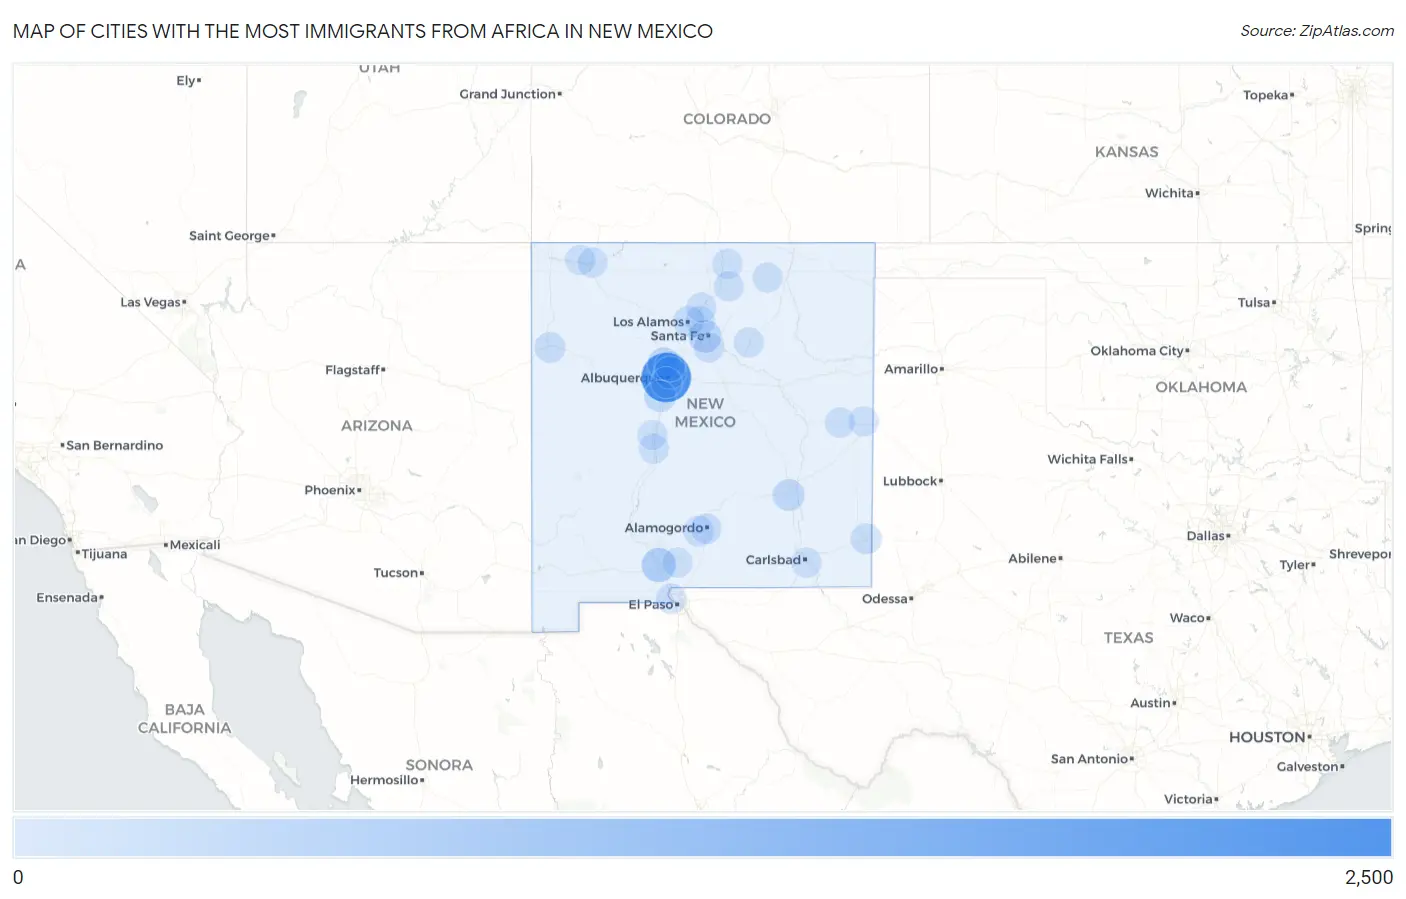
Map of Cities with the Most Immigrants from Africa in New Mexico
0
2,500
Cities with the Most Immigrants from Africa in New Mexico
| City | Africa | vs State | vs National | |
| 1. | Albuquerque | 2,283 | 4,799(47.57%)#1 | 2,580,172(0.09%)#150 |
| 2. | Las Cruces | 448 | 4,799(9.34%)#2 | 2,580,172(0.02%)#815 |
| 3. | Santa Fe | 289 | 4,799(6.02%)#3 | 2,580,172(0.01%)#1,149 |
| 4. | Rio Rancho | 251 | 4,799(5.23%)#4 | 2,580,172(0.01%)#1,265 |
| 5. | North Valley | 221 | 4,799(4.61%)#5 | 2,580,172(0.01%)#1,390 |
| 6. | Roswell | 178 | 4,799(3.71%)#6 | 2,580,172(0.01%)#1,584 |
| 7. | Los Lunas | 162 | 4,799(3.38%)#7 | 2,580,172(0.01%)#1,682 |
| 8. | South Valley | 97 | 4,799(2.02%)#8 | 2,580,172(0.00%)#2,266 |
| 9. | Los Alamos | 72 | 4,799(1.50%)#9 | 2,580,172(0.00%)#2,631 |
| 10. | Hobbs | 68 | 4,799(1.42%)#10 | 2,580,172(0.00%)#2,709 |
| 11. | Rio Rancho Estates | 68 | 4,799(1.42%)#11 | 2,580,172(0.00%)#2,731 |
| 12. | Gallup | 59 | 4,799(1.23%)#12 | 2,580,172(0.00%)#2,903 |
| 13. | Holloman Afb | 51 | 4,799(1.06%)#13 | 2,580,172(0.00%)#3,117 |
| 14. | Alamogordo | 37 | 4,799(0.77%)#14 | 2,580,172(0.00%)#3,533 |
| 15. | Sunland Park | 30 | 4,799(0.63%)#15 | 2,580,172(0.00%)#3,823 |
| 16. | Center Point | 30 | 4,799(0.63%)#16 | 2,580,172(0.00%)#3,845 |
| 17. | Eldorado At Santa Fe | 23 | 4,799(0.48%)#17 | 2,580,172(0.00%)#4,202 |
| 18. | Questa | 14 | 4,799(0.29%)#18 | 2,580,172(0.00%)#4,930 |
| 19. | Corrales | 13 | 4,799(0.27%)#19 | 2,580,172(0.00%)#4,972 |
| 20. | Kirtland Afb | 13 | 4,799(0.27%)#20 | 2,580,172(0.00%)#5,001 |
| 21. | Carlsbad | 12 | 4,799(0.25%)#21 | 2,580,172(0.00%)#5,054 |
| 22. | Socorro | 11 | 4,799(0.23%)#22 | 2,580,172(0.00%)#5,171 |
| 23. | Placitas Cdp Sandoval County | 11 | 4,799(0.23%)#23 | 2,580,172(0.00%)#5,201 |
| 24. | Paa-Ko | 8 | 4,799(0.17%)#24 | 2,580,172(0.00%)#5,594 |
| 25. | Clovis | 6 | 4,799(0.13%)#25 | 2,580,172(0.00%)#5,730 |
| 26. | El Rancho | 6 | 4,799(0.13%)#26 | 2,580,172(0.00%)#5,824 |
| 27. | Alamillo | 6 | 4,799(0.13%)#27 | 2,580,172(0.00%)#5,889 |
| 28. | Farmington | 5 | 4,799(0.10%)#28 | 2,580,172(0.00%)#5,895 |
| 29. | Bloomfield | 5 | 4,799(0.10%)#29 | 2,580,172(0.00%)#5,925 |
| 30. | Las Vegas | 3 | 4,799(0.06%)#30 | 2,580,172(0.00%)#6,261 |
| 31. | Taos | 3 | 4,799(0.06%)#31 | 2,580,172(0.00%)#6,272 |
| 32. | White Sands | 3 | 4,799(0.06%)#32 | 2,580,172(0.00%)#6,337 |
| 33. | Alcalde | 2 | 4,799(0.04%)#33 | 2,580,172(0.00%)#6,604 |
| 34. | Cimarron | 1 | 4,799(0.02%)#34 | 2,580,172(0.00%)#6,742 |
| 35. | Melrose | 1 | 4,799(0.02%)#35 | 2,580,172(0.00%)#6,771 |
Common Questions
What are the Top 10 Cities with the Most Immigrants from Africa in New Mexico?
Top 10 Cities with the Most Immigrants from Africa in New Mexico are:
#1
2,283
#2
448
#3
289
#4
251
#5
221
#6
178
#7
162
#8
97
#9
72
#10
68
What city has the Most Immigrants from Africa in New Mexico?
Albuquerque has the Most Immigrants from Africa in New Mexico with 2,283.
What is the Total Immigrants from Africa in the State of New Mexico?
Total Immigrants from Africa in New Mexico is 4,799.
What is the Total Immigrants from Africa in the United States?
Total Immigrants from Africa in the United States is 2,580,172.