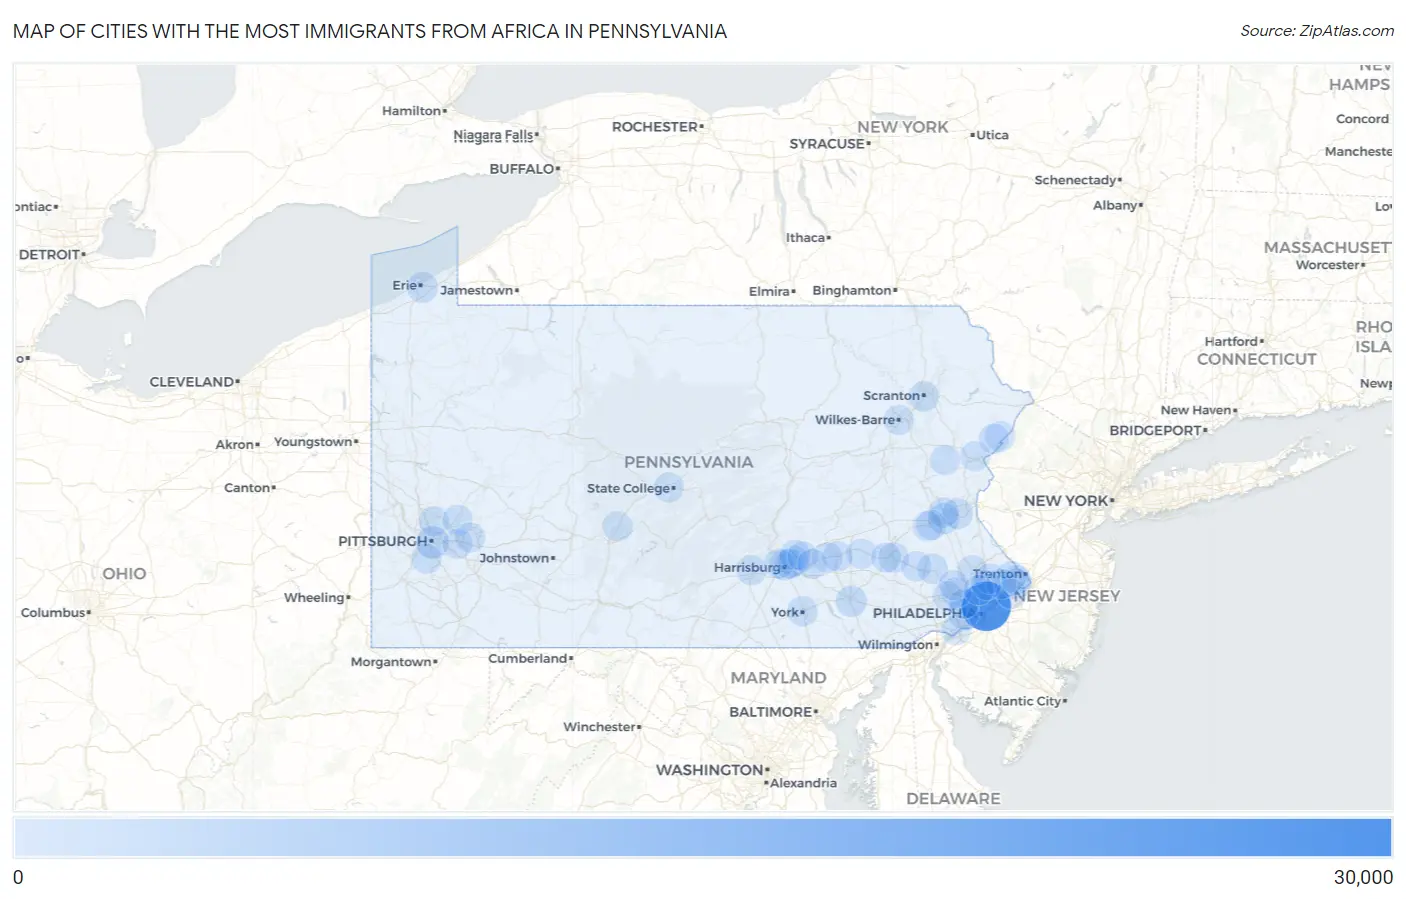
Cities with the Most Immigrants from Africa in Pennsylvania
RELATED REPORTS & OPTIONS
Africa
Pennsylvania
Compare Cities
Map of Cities with the Most Immigrants from Africa in Pennsylvania
0
30,000
Cities with the Most Immigrants from Africa in Pennsylvania
| City | Africa | vs State | vs National | |
| 1. | Philadelphia | 26,287 | 87,292(30.11%)#1 | 2,580,172(1.02%)#7 |
| 2. | Pittsburgh | 3,102 | 87,292(3.55%)#2 | 2,580,172(0.12%)#97 |
| 3. | Darby Borough | 1,493 | 87,292(1.71%)#3 | 2,580,172(0.06%)#260 |
| 4. | Allentown | 1,390 | 87,292(1.59%)#4 | 2,580,172(0.05%)#286 |
| 5. | Lancaster | 1,364 | 87,292(1.56%)#5 | 2,580,172(0.05%)#290 |
| 6. | Harrisburg | 1,105 | 87,292(1.27%)#6 | 2,580,172(0.04%)#370 |
| 7. | Erie | 1,033 | 87,292(1.18%)#7 | 2,580,172(0.04%)#391 |
| 8. | Yeadon Borough | 909 | 87,292(1.04%)#8 | 2,580,172(0.04%)#441 |
| 9. | Drexel Hill | 843 | 87,292(0.97%)#9 | 2,580,172(0.03%)#483 |
| 10. | Lansdowne Borough | 758 | 87,292(0.87%)#10 | 2,580,172(0.03%)#521 |
| 11. | Norristown Borough | 733 | 87,292(0.84%)#11 | 2,580,172(0.03%)#539 |
| 12. | Bethlehem | 729 | 87,292(0.84%)#12 | 2,580,172(0.03%)#544 |
| 13. | Colwyn Borough | 690 | 87,292(0.79%)#13 | 2,580,172(0.03%)#570 |
| 14. | Colonial Park | 669 | 87,292(0.77%)#14 | 2,580,172(0.03%)#581 |
| 15. | Sharon Hill Borough | 576 | 87,292(0.66%)#15 | 2,580,172(0.02%)#670 |
| 16. | Folcroft Borough | 519 | 87,292(0.59%)#16 | 2,580,172(0.02%)#713 |
| 17. | Scranton | 479 | 87,292(0.55%)#17 | 2,580,172(0.02%)#764 |
| 18. | Reading | 414 | 87,292(0.47%)#18 | 2,580,172(0.02%)#862 |
| 19. | Pine Ridge | 391 | 87,292(0.45%)#19 | 2,580,172(0.02%)#910 |
| 20. | Brentwood Borough | 384 | 87,292(0.44%)#20 | 2,580,172(0.01%)#923 |
| 21. | Linglestown | 358 | 87,292(0.41%)#21 | 2,580,172(0.01%)#982 |
| 22. | Collingdale Borough | 349 | 87,292(0.40%)#22 | 2,580,172(0.01%)#1,001 |
| 23. | Bridgeport Borough | 329 | 87,292(0.38%)#23 | 2,580,172(0.01%)#1,046 |
| 24. | Sanatoga | 305 | 87,292(0.35%)#24 | 2,580,172(0.01%)#1,113 |
| 25. | Fullerton | 291 | 87,292(0.33%)#25 | 2,580,172(0.01%)#1,145 |
| 26. | Chester | 278 | 87,292(0.32%)#26 | 2,580,172(0.01%)#1,172 |
| 27. | Schlusser | 272 | 87,292(0.31%)#27 | 2,580,172(0.01%)#1,187 |
| 28. | Lansdale Borough | 259 | 87,292(0.30%)#28 | 2,580,172(0.01%)#1,231 |
| 29. | Allison Park | 256 | 87,292(0.29%)#29 | 2,580,172(0.01%)#1,247 |
| 30. | Baldwin Borough | 250 | 87,292(0.29%)#30 | 2,580,172(0.01%)#1,269 |
| 31. | Aldan Borough | 239 | 87,292(0.27%)#31 | 2,580,172(0.01%)#1,308 |
| 32. | Clifton Heights Borough | 238 | 87,292(0.27%)#32 | 2,580,172(0.01%)#1,313 |
| 33. | York | 233 | 87,292(0.27%)#33 | 2,580,172(0.01%)#1,329 |
| 34. | Warminster Heights | 231 | 87,292(0.26%)#34 | 2,580,172(0.01%)#1,344 |
| 35. | State College Borough | 228 | 87,292(0.26%)#35 | 2,580,172(0.01%)#1,353 |
| 36. | Elizabethtown Borough | 222 | 87,292(0.25%)#36 | 2,580,172(0.01%)#1,381 |
| 37. | East Lansdowne Borough | 213 | 87,292(0.24%)#37 | 2,580,172(0.01%)#1,423 |
| 38. | King Of Prussia | 196 | 87,292(0.22%)#38 | 2,580,172(0.01%)#1,486 |
| 39. | Carlisle Borough | 196 | 87,292(0.22%)#39 | 2,580,172(0.01%)#1,488 |
| 40. | Greenwood | 191 | 87,292(0.22%)#40 | 2,580,172(0.01%)#1,521 |
| 41. | Millbourne Borough | 191 | 87,292(0.22%)#41 | 2,580,172(0.01%)#1,522 |
| 42. | Levittown | 189 | 87,292(0.22%)#42 | 2,580,172(0.01%)#1,525 |
| 43. | Wilkes Barre | 185 | 87,292(0.21%)#43 | 2,580,172(0.01%)#1,549 |
| 44. | Chesterbrook | 174 | 87,292(0.20%)#44 | 2,580,172(0.01%)#1,603 |
| 45. | Progress | 164 | 87,292(0.19%)#45 | 2,580,172(0.01%)#1,664 |
| 46. | Ambler Borough | 157 | 87,292(0.18%)#46 | 2,580,172(0.01%)#1,723 |
| 47. | Crafton Borough | 152 | 87,292(0.17%)#47 | 2,580,172(0.01%)#1,756 |
| 48. | Enola | 149 | 87,292(0.17%)#48 | 2,580,172(0.01%)#1,772 |
| 49. | Wyomissing Borough | 146 | 87,292(0.17%)#49 | 2,580,172(0.01%)#1,790 |
| 50. | South Coatesville Borough | 146 | 87,292(0.17%)#50 | 2,580,172(0.01%)#1,792 |
| 51. | Breinigsville | 145 | 87,292(0.17%)#51 | 2,580,172(0.01%)#1,798 |
| 52. | Whitehall Borough | 143 | 87,292(0.16%)#52 | 2,580,172(0.01%)#1,813 |
| 53. | Pottstown Borough | 138 | 87,292(0.16%)#53 | 2,580,172(0.01%)#1,860 |
| 54. | Arnold | 134 | 87,292(0.15%)#54 | 2,580,172(0.01%)#1,901 |
| 55. | East Stroudsburg Borough | 131 | 87,292(0.15%)#55 | 2,580,172(0.01%)#1,920 |
| 56. | Arlington Heights | 131 | 87,292(0.15%)#56 | 2,580,172(0.01%)#1,921 |
| 57. | Chalfont Borough | 129 | 87,292(0.15%)#57 | 2,580,172(0.00%)#1,934 |
| 58. | Woodbourne | 129 | 87,292(0.15%)#58 | 2,580,172(0.00%)#1,935 |
| 59. | Bethel Park | 127 | 87,292(0.15%)#59 | 2,580,172(0.00%)#1,948 |
| 60. | Trexlertown | 127 | 87,292(0.15%)#60 | 2,580,172(0.00%)#1,952 |
| 61. | Murrysville | 125 | 87,292(0.14%)#61 | 2,580,172(0.00%)#1,961 |
| 62. | Columbia Borough | 124 | 87,292(0.14%)#62 | 2,580,172(0.00%)#1,975 |
| 63. | Newmanstown | 123 | 87,292(0.14%)#63 | 2,580,172(0.00%)#1,990 |
| 64. | Annville | 122 | 87,292(0.14%)#64 | 2,580,172(0.00%)#1,995 |
| 65. | Swarthmore Borough | 121 | 87,292(0.14%)#65 | 2,580,172(0.00%)#2,005 |
| 66. | Brookhaven Borough | 119 | 87,292(0.14%)#66 | 2,580,172(0.00%)#2,025 |
| 67. | Skyline View | 116 | 87,292(0.13%)#67 | 2,580,172(0.00%)#2,048 |
| 68. | Bryn Mawr | 113 | 87,292(0.13%)#68 | 2,580,172(0.00%)#2,094 |
| 69. | Trevose | 110 | 87,292(0.13%)#69 | 2,580,172(0.00%)#2,125 |
| 70. | Saw Creek | 107 | 87,292(0.12%)#70 | 2,580,172(0.00%)#2,156 |
| 71. | Villanova | 105 | 87,292(0.12%)#71 | 2,580,172(0.00%)#2,174 |
| 72. | Penbrook Borough | 105 | 87,292(0.12%)#72 | 2,580,172(0.00%)#2,176 |
| 73. | Bristol Borough | 104 | 87,292(0.12%)#73 | 2,580,172(0.00%)#2,188 |
| 74. | Monroeville | 100 | 87,292(0.11%)#74 | 2,580,172(0.00%)#2,229 |
| 75. | Croydon | 96 | 87,292(0.11%)#75 | 2,580,172(0.00%)#2,285 |
| 76. | Fairless Hills | 93 | 87,292(0.11%)#76 | 2,580,172(0.00%)#2,323 |
| 77. | Schwenksville Borough | 93 | 87,292(0.11%)#77 | 2,580,172(0.00%)#2,326 |
| 78. | Wilkinsburg Borough | 91 | 87,292(0.10%)#78 | 2,580,172(0.00%)#2,344 |
| 79. | Quakertown Borough | 85 | 87,292(0.10%)#79 | 2,580,172(0.00%)#2,424 |
| 80. | Downingtown Borough | 84 | 87,292(0.10%)#80 | 2,580,172(0.00%)#2,435 |
| 81. | Bellefonte Borough | 83 | 87,292(0.10%)#81 | 2,580,172(0.00%)#2,450 |
| 82. | Prospect Park Borough | 82 | 87,292(0.09%)#82 | 2,580,172(0.00%)#2,466 |
| 83. | Lebanon | 81 | 87,292(0.09%)#83 | 2,580,172(0.00%)#2,477 |
| 84. | Willow Grove | 81 | 87,292(0.09%)#84 | 2,580,172(0.00%)#2,480 |
| 85. | Montgomeryville | 80 | 87,292(0.09%)#85 | 2,580,172(0.00%)#2,496 |
| 86. | Castle Shannon Borough | 80 | 87,292(0.09%)#86 | 2,580,172(0.00%)#2,499 |
| 87. | Amity Gardens | 78 | 87,292(0.09%)#87 | 2,580,172(0.00%)#2,529 |
| 88. | Plum Borough | 77 | 87,292(0.09%)#88 | 2,580,172(0.00%)#2,535 |
| 89. | Hershey | 77 | 87,292(0.09%)#89 | 2,580,172(0.00%)#2,537 |
| 90. | Edwardsville Borough | 75 | 87,292(0.09%)#90 | 2,580,172(0.00%)#2,581 |
| 91. | West Lawn | 73 | 87,292(0.08%)#91 | 2,580,172(0.00%)#2,618 |
| 92. | Phoenixville Borough | 72 | 87,292(0.08%)#92 | 2,580,172(0.00%)#2,626 |
| 93. | Glenolden Borough | 72 | 87,292(0.08%)#93 | 2,580,172(0.00%)#2,642 |
| 94. | Sun Valley | 72 | 87,292(0.08%)#94 | 2,580,172(0.00%)#2,645 |
| 95. | Trooper | 70 | 87,292(0.08%)#95 | 2,580,172(0.00%)#2,679 |
| 96. | West Chester Borough | 68 | 87,292(0.08%)#96 | 2,580,172(0.00%)#2,718 |
| 97. | Park Forest Village | 68 | 87,292(0.08%)#97 | 2,580,172(0.00%)#2,723 |
| 98. | Oreland | 66 | 87,292(0.08%)#98 | 2,580,172(0.00%)#2,767 |
| 99. | Morton Borough | 66 | 87,292(0.08%)#99 | 2,580,172(0.00%)#2,770 |
| 100. | Dover Borough | 66 | 87,292(0.08%)#100 | 2,580,172(0.00%)#2,771 |
Common Questions
What are the Top 10 Cities with the Most Immigrants from Africa in Pennsylvania?
Top 10 Cities with the Most Immigrants from Africa in Pennsylvania are:
#1
26,287
#2
3,102
#3
1,390
#4
1,364
#5
1,105
#6
1,033
#7
843
#8
729
#9
669
#10
479
What city has the Most Immigrants from Africa in Pennsylvania?
Philadelphia has the Most Immigrants from Africa in Pennsylvania with 26,287.
What is the Total Immigrants from Africa in the State of Pennsylvania?
Total Immigrants from Africa in Pennsylvania is 87,292.
What is the Total Immigrants from Africa in the United States?
Total Immigrants from Africa in the United States is 2,580,172.