Cities with the Most Immigrants from Africa in New York
RELATED REPORTS & OPTIONS
Africa
New York
Compare Cities
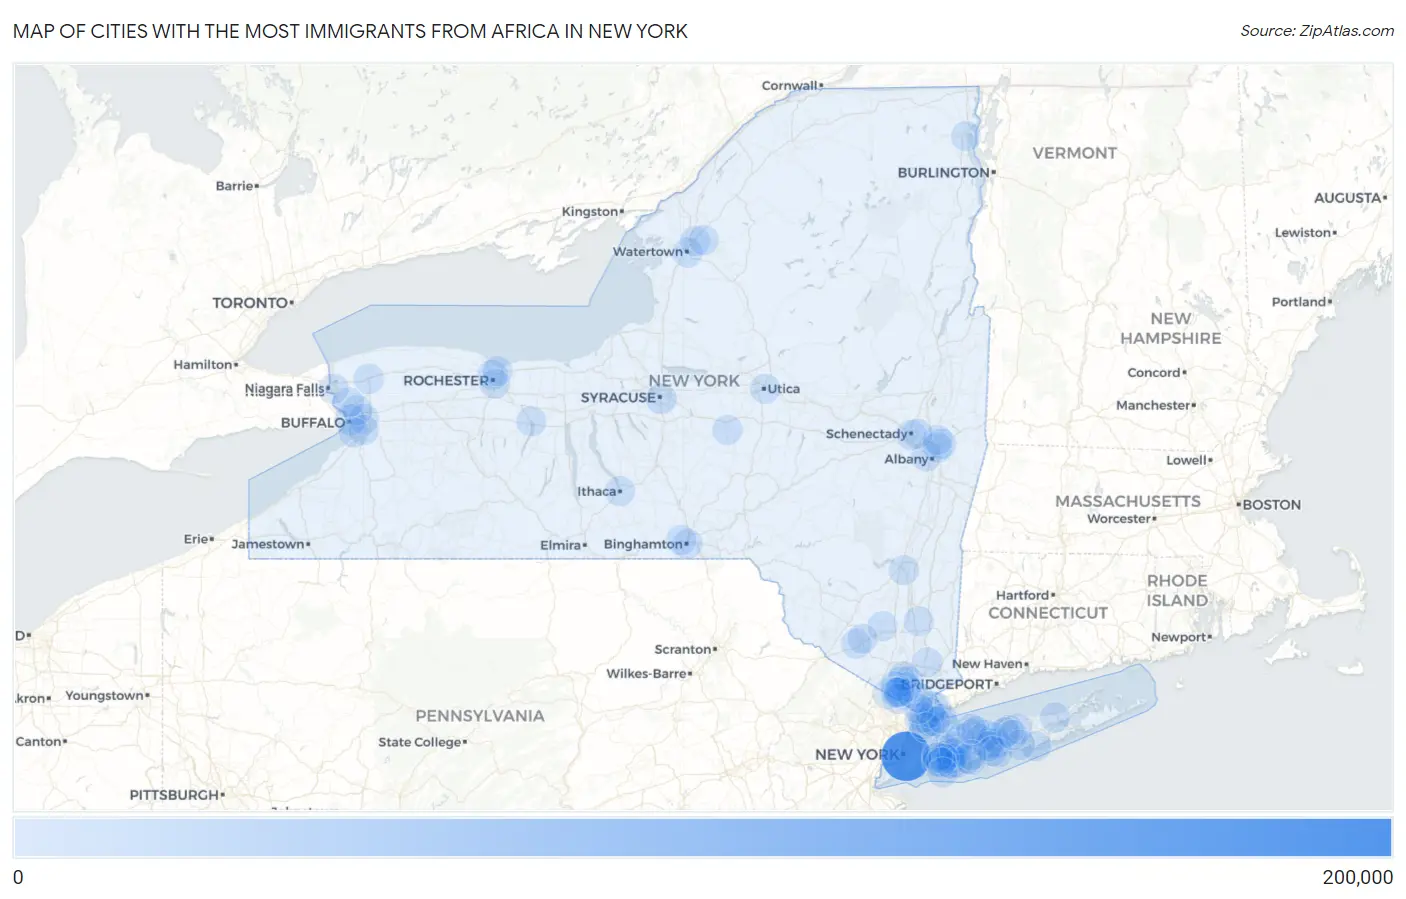
Map of Cities with the Most Immigrants from Africa in New York
0
200,000
Cities with the Most Immigrants from Africa in New York
| City | Africa | vs State | vs National | |
| 1. | New York | 155,711 | 216,682(71.86%)#1 | 2,580,172(6.03%)#1 |
| 2. | Buffalo | 5,771 | 216,682(2.66%)#2 | 2,580,172(0.22%)#50 |
| 3. | Syracuse | 4,675 | 216,682(2.16%)#3 | 2,580,172(0.18%)#66 |
| 4. | Yonkers | 3,274 | 216,682(1.51%)#4 | 2,580,172(0.13%)#91 |
| 5. | Rochester | 2,812 | 216,682(1.30%)#5 | 2,580,172(0.11%)#108 |
| 6. | Albany | 1,632 | 216,682(0.75%)#6 | 2,580,172(0.06%)#229 |
| 7. | Mount Vernon | 1,342 | 216,682(0.62%)#7 | 2,580,172(0.05%)#295 |
| 8. | New Rochelle | 1,271 | 216,682(0.59%)#8 | 2,580,172(0.05%)#315 |
| 9. | Troy | 935 | 216,682(0.43%)#9 | 2,580,172(0.04%)#431 |
| 10. | Brentwood | 930 | 216,682(0.43%)#10 | 2,580,172(0.04%)#433 |
| 11. | Elmont | 870 | 216,682(0.40%)#11 | 2,580,172(0.03%)#466 |
| 12. | Valley Stream | 851 | 216,682(0.39%)#12 | 2,580,172(0.03%)#476 |
| 13. | Coram | 732 | 216,682(0.34%)#13 | 2,580,172(0.03%)#541 |
| 14. | Utica | 728 | 216,682(0.34%)#14 | 2,580,172(0.03%)#547 |
| 15. | Brighton | 575 | 216,682(0.27%)#15 | 2,580,172(0.02%)#672 |
| 16. | Harrison | 559 | 216,682(0.26%)#16 | 2,580,172(0.02%)#681 |
| 17. | Cheektowaga | 549 | 216,682(0.25%)#17 | 2,580,172(0.02%)#689 |
| 18. | Hempstead | 483 | 216,682(0.22%)#18 | 2,580,172(0.02%)#755 |
| 19. | Ithaca | 447 | 216,682(0.21%)#19 | 2,580,172(0.02%)#816 |
| 20. | Binghamton | 416 | 216,682(0.19%)#20 | 2,580,172(0.02%)#860 |
| 21. | Schenectady | 413 | 216,682(0.19%)#21 | 2,580,172(0.02%)#866 |
| 22. | Nanuet | 374 | 216,682(0.17%)#22 | 2,580,172(0.01%)#942 |
| 23. | Baldwin | 364 | 216,682(0.17%)#23 | 2,580,172(0.01%)#966 |
| 24. | White Plains | 347 | 216,682(0.16%)#24 | 2,580,172(0.01%)#1,004 |
| 25. | Glen Cove | 342 | 216,682(0.16%)#25 | 2,580,172(0.01%)#1,014 |
| 26. | Freeport | 329 | 216,682(0.15%)#26 | 2,580,172(0.01%)#1,044 |
| 27. | Uniondale | 328 | 216,682(0.15%)#27 | 2,580,172(0.01%)#1,048 |
| 28. | Suffern | 311 | 216,682(0.14%)#28 | 2,580,172(0.01%)#1,096 |
| 29. | Dix Hills | 309 | 216,682(0.14%)#29 | 2,580,172(0.01%)#1,100 |
| 30. | Tuckahoe | 280 | 216,682(0.13%)#30 | 2,580,172(0.01%)#1,168 |
| 31. | Centereach | 269 | 216,682(0.12%)#31 | 2,580,172(0.01%)#1,193 |
| 32. | Watertown | 264 | 216,682(0.12%)#32 | 2,580,172(0.01%)#1,211 |
| 33. | Huntington Station | 263 | 216,682(0.12%)#33 | 2,580,172(0.01%)#1,214 |
| 34. | Eggertsville | 262 | 216,682(0.12%)#34 | 2,580,172(0.01%)#1,219 |
| 35. | Calcium | 259 | 216,682(0.12%)#35 | 2,580,172(0.01%)#1,233 |
| 36. | Mastic Beach | 250 | 216,682(0.12%)#36 | 2,580,172(0.01%)#1,270 |
| 37. | Scarsdale | 246 | 216,682(0.11%)#37 | 2,580,172(0.01%)#1,283 |
| 38. | Tonawanda | 243 | 216,682(0.11%)#38 | 2,580,172(0.01%)#1,293 |
| 39. | Pelham Manor | 240 | 216,682(0.11%)#39 | 2,580,172(0.01%)#1,301 |
| 40. | Central Islip | 217 | 216,682(0.10%)#40 | 2,580,172(0.01%)#1,402 |
| 41. | East Patchogue | 216 | 216,682(0.10%)#41 | 2,580,172(0.01%)#1,407 |
| 42. | Mamaroneck | 214 | 216,682(0.10%)#42 | 2,580,172(0.01%)#1,413 |
| 43. | Fort Drum | 208 | 216,682(0.10%)#43 | 2,580,172(0.01%)#1,441 |
| 44. | Plattsburgh | 205 | 216,682(0.09%)#44 | 2,580,172(0.01%)#1,450 |
| 45. | Rye | 205 | 216,682(0.09%)#45 | 2,580,172(0.01%)#1,451 |
| 46. | Mineola | 196 | 216,682(0.09%)#46 | 2,580,172(0.01%)#1,487 |
| 47. | West Hempstead | 196 | 216,682(0.09%)#47 | 2,580,172(0.01%)#1,489 |
| 48. | Valley Cottage | 196 | 216,682(0.09%)#48 | 2,580,172(0.01%)#1,490 |
| 49. | New Cassel | 191 | 216,682(0.09%)#49 | 2,580,172(0.01%)#1,519 |
| 50. | Irondequoit | 187 | 216,682(0.09%)#50 | 2,580,172(0.01%)#1,539 |
| 51. | Lockport | 181 | 216,682(0.08%)#51 | 2,580,172(0.01%)#1,572 |
| 52. | Bellmore | 181 | 216,682(0.08%)#52 | 2,580,172(0.01%)#1,575 |
| 53. | Mount Ivy | 180 | 216,682(0.08%)#53 | 2,580,172(0.01%)#1,580 |
| 54. | East Meadow | 172 | 216,682(0.08%)#54 | 2,580,172(0.01%)#1,608 |
| 55. | Walden | 168 | 216,682(0.08%)#55 | 2,580,172(0.01%)#1,625 |
| 56. | Commack | 167 | 216,682(0.08%)#56 | 2,580,172(0.01%)#1,627 |
| 57. | Jefferson Valley Yorktown | 165 | 216,682(0.08%)#57 | 2,580,172(0.01%)#1,649 |
| 58. | Haverstraw | 165 | 216,682(0.08%)#58 | 2,580,172(0.01%)#1,650 |
| 59. | Roosevelt | 164 | 216,682(0.08%)#59 | 2,580,172(0.01%)#1,660 |
| 60. | Roessleville | 163 | 216,682(0.08%)#60 | 2,580,172(0.01%)#1,674 |
| 61. | Sleepy Hollow | 163 | 216,682(0.08%)#61 | 2,580,172(0.01%)#1,676 |
| 62. | Amityville | 161 | 216,682(0.07%)#62 | 2,580,172(0.01%)#1,695 |
| 63. | Syosset | 157 | 216,682(0.07%)#63 | 2,580,172(0.01%)#1,720 |
| 64. | Johnson City | 151 | 216,682(0.07%)#64 | 2,580,172(0.01%)#1,758 |
| 65. | Hauppauge | 145 | 216,682(0.07%)#65 | 2,580,172(0.01%)#1,795 |
| 66. | Greenlawn | 141 | 216,682(0.07%)#66 | 2,580,172(0.01%)#1,838 |
| 67. | Dobbs Ferry | 141 | 216,682(0.07%)#67 | 2,580,172(0.01%)#1,839 |
| 68. | Wesley Hills | 141 | 216,682(0.07%)#68 | 2,580,172(0.01%)#1,841 |
| 69. | Riverhead | 139 | 216,682(0.06%)#69 | 2,580,172(0.01%)#1,855 |
| 70. | West Seneca | 138 | 216,682(0.06%)#70 | 2,580,172(0.01%)#1,856 |
| 71. | New City | 133 | 216,682(0.06%)#71 | 2,580,172(0.01%)#1,904 |
| 72. | Watervliet | 131 | 216,682(0.06%)#72 | 2,580,172(0.01%)#1,919 |
| 73. | East Islip | 130 | 216,682(0.06%)#73 | 2,580,172(0.01%)#1,928 |
| 74. | Lake Grove | 129 | 216,682(0.06%)#74 | 2,580,172(0.00%)#1,932 |
| 75. | Niagara Falls | 128 | 216,682(0.06%)#75 | 2,580,172(0.00%)#1,937 |
| 76. | Stony Point | 125 | 216,682(0.06%)#76 | 2,580,172(0.00%)#1,966 |
| 77. | Hillcrest | 124 | 216,682(0.06%)#77 | 2,580,172(0.00%)#1,977 |
| 78. | Latham | 120 | 216,682(0.06%)#78 | 2,580,172(0.00%)#2,013 |
| 79. | Hamilton | 119 | 216,682(0.05%)#79 | 2,580,172(0.00%)#2,026 |
| 80. | Cohoes | 118 | 216,682(0.05%)#80 | 2,580,172(0.00%)#2,029 |
| 81. | East Massapequa | 117 | 216,682(0.05%)#81 | 2,580,172(0.00%)#2,036 |
| 82. | North Bay Shore | 116 | 216,682(0.05%)#82 | 2,580,172(0.00%)#2,044 |
| 83. | Lakeview | 115 | 216,682(0.05%)#83 | 2,580,172(0.00%)#2,065 |
| 84. | Huntington | 113 | 216,682(0.05%)#84 | 2,580,172(0.00%)#2,082 |
| 85. | Chestnut Ridge | 113 | 216,682(0.05%)#85 | 2,580,172(0.00%)#2,089 |
| 86. | Spring Valley | 112 | 216,682(0.05%)#86 | 2,580,172(0.00%)#2,097 |
| 87. | Canandaigua | 112 | 216,682(0.05%)#87 | 2,580,172(0.00%)#2,105 |
| 88. | Kingston | 111 | 216,682(0.05%)#88 | 2,580,172(0.00%)#2,111 |
| 89. | Lackawanna | 111 | 216,682(0.05%)#89 | 2,580,172(0.00%)#2,112 |
| 90. | Islip | 111 | 216,682(0.05%)#90 | 2,580,172(0.00%)#2,114 |
| 91. | Middletown | 110 | 216,682(0.05%)#91 | 2,580,172(0.00%)#2,117 |
| 92. | North Amityville | 105 | 216,682(0.05%)#92 | 2,580,172(0.00%)#2,169 |
| 93. | North Valley Stream | 104 | 216,682(0.05%)#93 | 2,580,172(0.00%)#2,185 |
| 94. | Scotchtown | 104 | 216,682(0.05%)#94 | 2,580,172(0.00%)#2,187 |
| 95. | Myers Corner | 103 | 216,682(0.05%)#95 | 2,580,172(0.00%)#2,198 |
| 96. | Monsey | 102 | 216,682(0.05%)#96 | 2,580,172(0.00%)#2,205 |
| 97. | Lynbrook | 102 | 216,682(0.05%)#97 | 2,580,172(0.00%)#2,207 |
| 98. | Niskayuna | 101 | 216,682(0.05%)#98 | 2,580,172(0.00%)#2,217 |
| 99. | Long Beach | 98 | 216,682(0.05%)#99 | 2,580,172(0.00%)#2,257 |
| 100. | Farmingville | 98 | 216,682(0.05%)#100 | 2,580,172(0.00%)#2,262 |
Common Questions
What are the Top 10 Cities with the Most Immigrants from Africa in New York?
Top 10 Cities with the Most Immigrants from Africa in New York are:
#1
155,711
#2
5,771
#3
4,675
#4
3,274
#5
2,812
#6
1,632
#7
1,342
#8
1,271
#9
935
#10
930
What city has the Most Immigrants from Africa in New York?
New York has the Most Immigrants from Africa in New York with 155,711.
What is the Total Immigrants from Africa in the State of New York?
Total Immigrants from Africa in New York is 216,682.
What is the Total Immigrants from Africa in the United States?
Total Immigrants from Africa in the United States is 2,580,172.