Cities with the Highest Percentage of Immigrants from Vietnam in Texas
RELATED REPORTS & OPTIONS
Vietnam
Texas
Compare Cities
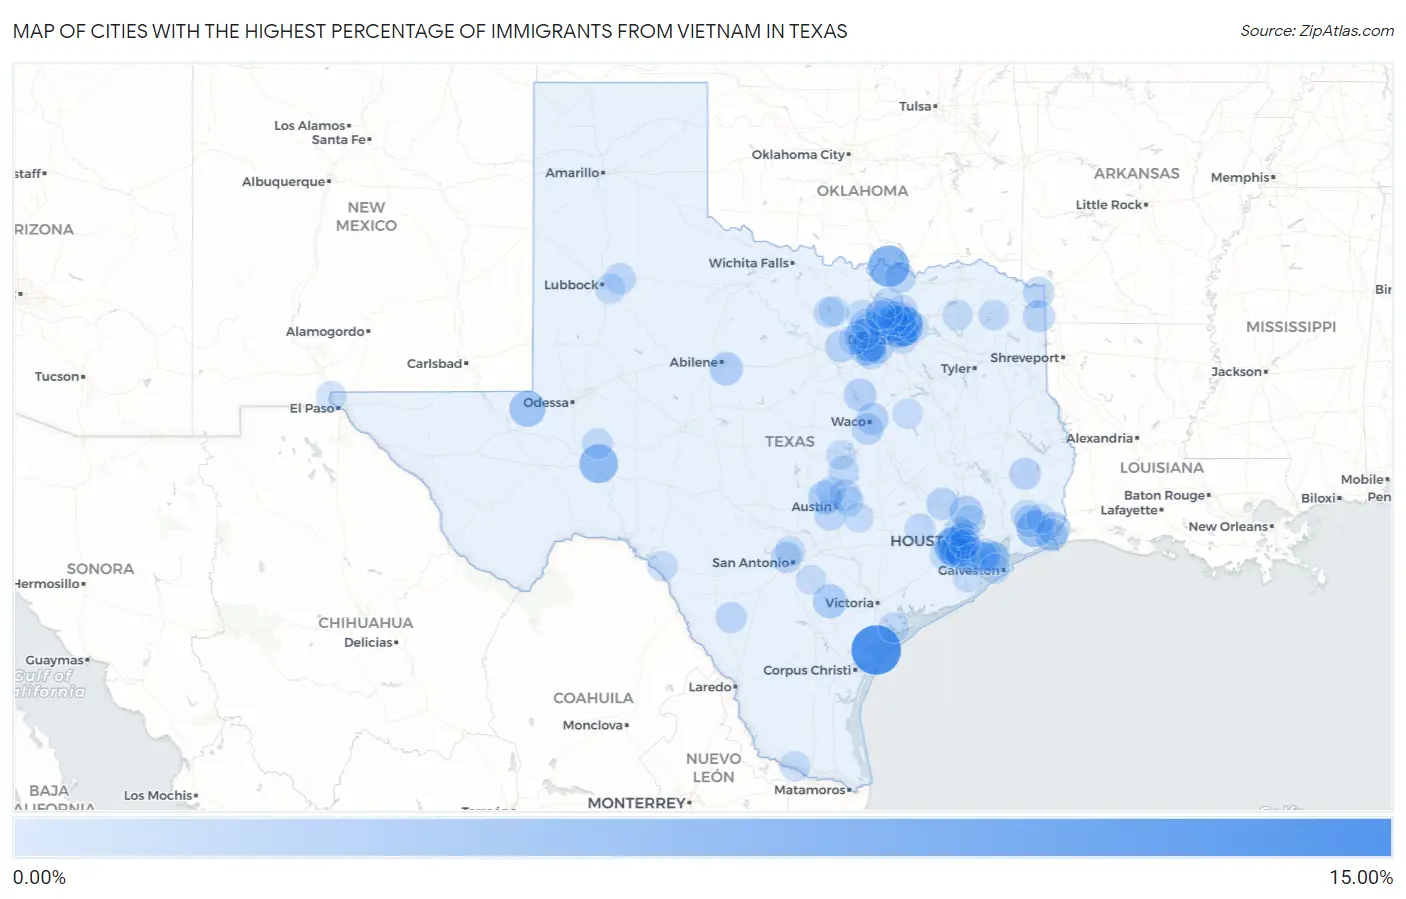
Map of Cities with the Highest Percentage of Immigrants from Vietnam in Texas
0.00%
15.00%
Cities with the Highest Percentage of Immigrants from Vietnam in Texas
| City | Vietnam | vs State | vs National | |
| 1. | Fulton | 13.22% | 0.63%(+12.6)#-1 | 0.41%(+12.8)#0 |
| 2. | Sherwood Shores | 7.84% | 0.63%(+7.21)#0 | 0.41%(+7.43)#1 |
| 3. | Sachse | 7.34% | 0.63%(+6.71)#51 | 0.41%(+6.94)#814 |
| 4. | Four Corners | 6.24% | 0.63%(+5.61)#80 | 0.41%(+5.83)#1,572 |
| 5. | Iraan | 6.06% | 0.63%(+5.42)#81 | 0.41%(+5.65)#1,573 |
| 6. | Fannett | 4.74% | 0.63%(+4.11)#82 | 0.41%(+4.33)#1,574 |
| 7. | Wink | 4.40% | 0.63%(+3.76)#83 | 0.41%(+3.99)#1,575 |
| 8. | Murphy | 4.35% | 0.63%(+3.72)#84 | 0.41%(+3.95)#1,576 |
| 9. | Garland | 4.16% | 0.63%(+3.53)#125 | 0.41%(+3.76)#2,388 |
| 10. | Meadows Place | 3.98% | 0.63%(+3.35)#126 | 0.41%(+3.58)#2,389 |
| 11. | Stafford | 3.80% | 0.63%(+3.17)#127 | 0.41%(+3.39)#2,390 |
| 12. | Haltom City | 3.78% | 0.63%(+3.15)#128 | 0.41%(+3.37)#2,391 |
| 13. | Dalworthington Gardens | 3.45% | 0.63%(+2.82)#129 | 0.41%(+3.04)#2,392 |
| 14. | Mission Bend | 3.39% | 0.63%(+2.76)#130 | 0.41%(+2.99)#2,393 |
| 15. | Kenedy | 3.14% | 0.63%(+2.51)#131 | 0.41%(+2.74)#2,394 |
| 16. | Kennedale | 2.91% | 0.63%(+2.28)#132 | 0.41%(+2.50)#2,395 |
| 17. | Hudson Bend | 2.81% | 0.63%(+2.17)#133 | 0.41%(+2.40)#2,396 |
| 18. | Potosi | 2.74% | 0.63%(+2.11)#134 | 0.41%(+2.33)#2,397 |
| 19. | Groves | 2.74% | 0.63%(+2.10)#135 | 0.41%(+2.33)#2,398 |
| 20. | Arlington | 2.73% | 0.63%(+2.10)#143 | 0.41%(+2.32)#2,689 |
| 21. | Shenandoah | 2.64% | 0.63%(+2.01)#144 | 0.41%(+2.24)#2,690 |
| 22. | Sugar Land | 2.60% | 0.63%(+1.97)#145 | 0.41%(+2.19)#2,691 |
| 23. | Port Arthur | 2.24% | 0.63%(+1.61)#153 | 0.41%(+1.84)#2,825 |
| 24. | Whitney | 2.23% | 0.63%(+1.59)#154 | 0.41%(+1.82)#2,826 |
| 25. | Pearland | 2.18% | 0.63%(+1.54)#167 | 0.41%(+1.77)#2,953 |
| 26. | Hackberry | 2.17% | 0.63%(+1.53)#168 | 0.41%(+1.76)#2,954 |
| 27. | Annetta South | 2.05% | 0.63%(+1.42)#169 | 0.41%(+1.64)#2,955 |
| 28. | Bellmead | 1.98% | 0.63%(+1.34)#170 | 0.41%(+1.57)#2,956 |
| 29. | Rowlett | 1.97% | 0.63%(+1.34)#171 | 0.41%(+1.57)#2,957 |
| 30. | Wylie | 1.97% | 0.63%(+1.33)#172 | 0.41%(+1.56)#2,958 |
| 31. | Grand Prairie | 1.92% | 0.63%(+1.29)#173 | 0.41%(+1.52)#2,959 |
| 32. | Plantersville | 1.89% | 0.63%(+1.26)#174 | 0.41%(+1.48)#2,960 |
| 33. | Atlanta | 1.89% | 0.63%(+1.26)#175 | 0.41%(+1.48)#2,961 |
| 34. | China | 1.86% | 0.63%(+1.23)#176 | 0.41%(+1.45)#2,962 |
| 35. | Hewitt | 1.78% | 0.63%(+1.15)#177 | 0.41%(+1.38)#2,963 |
| 36. | Woodville | 1.75% | 0.63%(+1.12)#178 | 0.41%(+1.35)#2,964 |
| 37. | Westlake | 1.69% | 0.63%(+1.06)#179 | 0.41%(+1.28)#2,965 |
| 38. | Red Lick | 1.64% | 0.63%(+1.01)#180 | 0.41%(+1.23)#2,966 |
| 39. | Hedwig Village | 1.59% | 0.63%(+0.963)#181 | 0.41%(+1.19)#2,967 |
| 40. | Nassau Bay | 1.59% | 0.63%(+0.960)#182 | 0.41%(+1.18)#2,968 |
| 41. | Pflugerville | 1.54% | 0.63%(+0.912)#183 | 0.41%(+1.14)#2,969 |
| 42. | Lorenzo | 1.48% | 0.63%(+0.849)#184 | 0.41%(+1.07)#2,970 |
| 43. | Manchaca | 1.47% | 0.63%(+0.838)#185 | 0.41%(+1.06)#2,971 |
| 44. | Carrollton | 1.45% | 0.63%(+0.820)#186 | 0.41%(+1.04)#2,972 |
| 45. | Southlake | 1.44% | 0.63%(+0.807)#187 | 0.41%(+1.03)#2,973 |
| 46. | Knollwood | 1.42% | 0.63%(+0.785)#188 | 0.41%(+1.01)#2,974 |
| 47. | Richardson | 1.41% | 0.63%(+0.783)#189 | 0.41%(+1.01)#2,975 |
| 48. | Mansfield | 1.40% | 0.63%(+0.763)#190 | 0.41%(+0.988)#2,976 |
| 49. | Big Wells | 1.39% | 0.63%(+0.757)#191 | 0.41%(+0.981)#2,977 |
| 50. | Leon Valley | 1.33% | 0.63%(+0.700)#192 | 0.41%(+0.925)#2,978 |
| 51. | Missouri City | 1.33% | 0.63%(+0.699)#193 | 0.41%(+0.924)#2,979 |
| 52. | Houston | 1.22% | 0.63%(+0.588)#194 | 0.41%(+0.812)#2,980 |
| 53. | Bacliff | 1.20% | 0.63%(+0.571)#195 | 0.41%(+0.795)#2,981 |
| 54. | Farmers Branch | 1.20% | 0.63%(+0.569)#196 | 0.41%(+0.793)#2,982 |
| 55. | Sonterra | 1.18% | 0.63%(+0.544)#197 | 0.41%(+0.768)#2,983 |
| 56. | Rankin | 1.12% | 0.63%(+0.491)#198 | 0.41%(+0.715)#2,984 |
| 57. | Mount Pleasant | 1.12% | 0.63%(+0.489)#199 | 0.41%(+0.713)#2,985 |
| 58. | Runaway Bay | 1.09% | 0.63%(+0.460)#200 | 0.41%(+0.685)#2,986 |
| 59. | Seadrift | 1.08% | 0.63%(+0.446)#201 | 0.41%(+0.670)#2,987 |
| 60. | Manvel | 1.06% | 0.63%(+0.425)#202 | 0.41%(+0.649)#2,988 |
| 61. | Friendswood | 1.03% | 0.63%(+0.400)#203 | 0.41%(+0.624)#2,989 |
| 62. | Bellville | 1.02% | 0.63%(+0.392)#204 | 0.41%(+0.616)#2,990 |
| 63. | Allen | 1.00% | 0.63%(+0.365)#205 | 0.41%(+0.589)#2,991 |
| 64. | Rosenberg | 0.97% | 0.63%(+0.339)#206 | 0.41%(+0.563)#2,992 |
| 65. | Sour Lake | 0.96% | 0.63%(+0.328)#207 | 0.41%(+0.553)#2,993 |
| 66. | Buffalo Springs | 0.94% | 0.63%(+0.312)#208 | 0.41%(+0.536)#2,994 |
| 67. | Dish | 0.93% | 0.63%(+0.299)#209 | 0.41%(+0.523)#2,995 |
| 68. | San Leon | 0.93% | 0.63%(+0.297)#210 | 0.41%(+0.521)#2,996 |
| 69. | Sunnyvale | 0.91% | 0.63%(+0.283)#211 | 0.41%(+0.507)#2,997 |
| 70. | Laughlin Afb | 0.91% | 0.63%(+0.280)#212 | 0.41%(+0.504)#2,998 |
| 71. | La Joya | 0.91% | 0.63%(+0.274)#213 | 0.41%(+0.498)#2,999 |
| 72. | Fate | 0.87% | 0.63%(+0.236)#214 | 0.41%(+0.460)#3,000 |
| 73. | Canutillo | 0.87% | 0.63%(+0.236)#215 | 0.41%(+0.460)#3,001 |
| 74. | Lucas | 0.85% | 0.63%(+0.220)#216 | 0.41%(+0.444)#3,002 |
| 75. | Bridgeport | 0.84% | 0.63%(+0.212)#217 | 0.41%(+0.436)#3,003 |
| 76. | Sulphur Springs | 0.84% | 0.63%(+0.204)#218 | 0.41%(+0.428)#3,004 |
| 77. | Parker | 0.83% | 0.63%(+0.194)#219 | 0.41%(+0.418)#3,005 |
| 78. | Plano | 0.82% | 0.63%(+0.187)#220 | 0.41%(+0.411)#3,006 |
| 79. | Shavano Park | 0.82% | 0.63%(+0.186)#221 | 0.41%(+0.411)#3,007 |
| 80. | Jersey Village | 0.81% | 0.63%(+0.180)#222 | 0.41%(+0.404)#3,008 |
| 81. | Spring | 0.80% | 0.63%(+0.172)#223 | 0.41%(+0.396)#3,009 |
| 82. | League City | 0.80% | 0.63%(+0.168)#224 | 0.41%(+0.393)#3,010 |
| 83. | Bellaire | 0.80% | 0.63%(+0.166)#225 | 0.41%(+0.391)#3,011 |
| 84. | New Hope | 0.79% | 0.63%(+0.156)#226 | 0.41%(+0.381)#3,012 |
| 85. | Lewisville | 0.78% | 0.63%(+0.144)#227 | 0.41%(+0.368)#3,013 |
| 86. | Manor | 0.78% | 0.63%(+0.144)#228 | 0.41%(+0.368)#3,014 |
| 87. | Frisco | 0.75% | 0.63%(+0.120)#229 | 0.41%(+0.344)#3,015 |
| 88. | Bayou Vista | 0.75% | 0.63%(+0.116)#230 | 0.41%(+0.340)#3,016 |
| 89. | North Richland Hills | 0.74% | 0.63%(+0.107)#231 | 0.41%(+0.331)#3,017 |
| 90. | Mexia | 0.74% | 0.63%(+0.107)#232 | 0.41%(+0.331)#3,018 |
| 91. | Floresville | 0.73% | 0.63%(+0.094)#233 | 0.41%(+0.318)#3,019 |
| 92. | Reno City Lamar County | 0.72% | 0.63%(+0.093)#234 | 0.41%(+0.317)#3,020 |
| 93. | Celina | 0.71% | 0.63%(+0.075)#235 | 0.41%(+0.299)#3,021 |
| 94. | Bastrop | 0.70% | 0.63%(+0.071)#236 | 0.41%(+0.296)#3,022 |
| 95. | Cedar Park | 0.69% | 0.63%(+0.058)#237 | 0.41%(+0.283)#3,023 |
| 96. | Beaumont | 0.67% | 0.63%(+0.038)#238 | 0.41%(+0.262)#3,024 |
| 97. | Lakewood Village | 0.67% | 0.63%(+0.038)#239 | 0.41%(+0.262)#3,025 |
| 98. | Angleton | 0.66% | 0.63%(+0.031)#240 | 0.41%(+0.256)#3,026 |
| 99. | Harker Heights | 0.66% | 0.63%(+0.025)#241 | 0.41%(+0.249)#3,027 |
| 100. | Westworth Village | 0.65% | 0.63%(+0.023)#242 | 0.41%(+0.247)#3,028 |
Common Questions
What are the Top 10 Cities with the Highest Percentage of Immigrants from Vietnam in Texas?
Top 10 Cities with the Highest Percentage of Immigrants from Vietnam in Texas are:
#1
13.22%
#2
7.84%
#3
7.34%
#4
6.24%
#5
6.06%
#6
4.74%
#7
4.40%
#8
4.35%
#9
4.16%
#10
3.98%
What city has the Highest Percentage of Immigrants from Vietnam in Texas?
Fulton has the Highest Percentage of Immigrants from Vietnam in Texas with 13.22%.
What is the Percentage of Immigrants from Vietnam in the State of Texas?
Percentage of Immigrants from Vietnam in Texas is 0.63%.
What is the Percentage of Immigrants from Vietnam in the United States?
Percentage of Immigrants from Vietnam in the United States is 0.41%.