Cities with the Highest Percentage of Immigrants from Vietnam in Pennsylvania
RELATED REPORTS & OPTIONS
Vietnam
Pennsylvania
Compare Cities
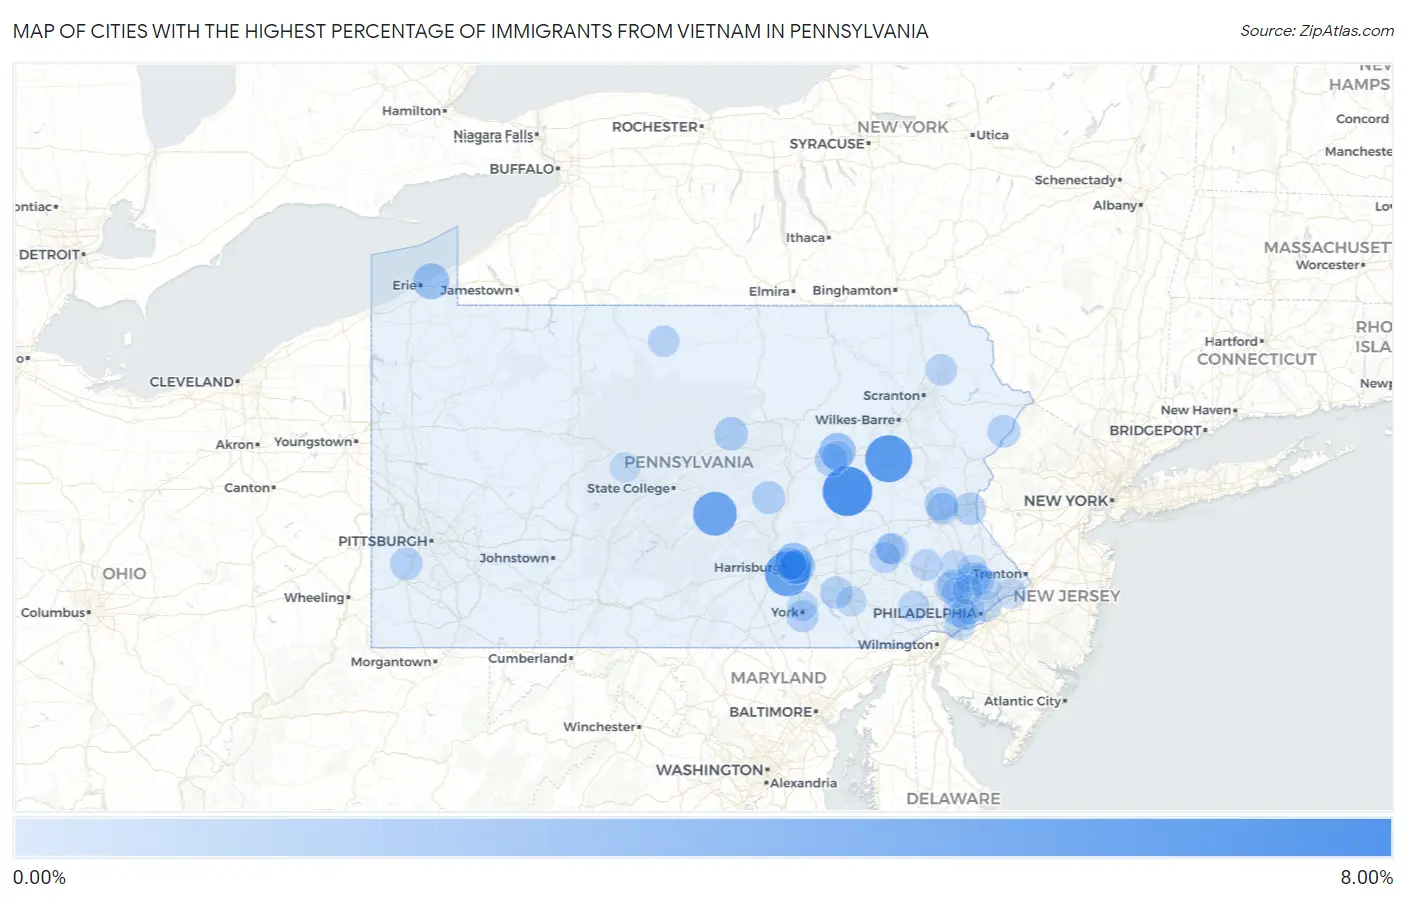
Map of Cities with the Highest Percentage of Immigrants from Vietnam in Pennsylvania
0.00%
8.00%
Cities with the Highest Percentage of Immigrants from Vietnam in Pennsylvania
| City | Vietnam | vs State | vs National | |
| 1. | Fountain Springs | 6.90% | 0.24%(+6.65)#-1 | 0.41%(+6.49)#0 |
| 2. | Harleigh | 6.05% | 0.24%(+5.81)#0 | 0.41%(+5.64)#1 |
| 3. | New Market | 5.41% | 0.24%(+5.17)#1 | 0.41%(+5.01)#2 |
| 4. | Maitland | 4.95% | 0.24%(+4.71)#2 | 0.41%(+4.54)#3 |
| 5. | Paxtang Borough | 4.82% | 0.24%(+4.58)#3 | 0.41%(+4.41)#4 |
| 6. | Quarryville Borough | 4.77% | 0.24%(+4.52)#4 | 0.41%(+4.36)#5 |
| 7. | Halifax Borough | 3.44% | 0.24%(+3.20)#5 | 0.41%(+3.03)#6 |
| 8. | Mont Alto Borough | 3.33% | 0.24%(+3.09)#6 | 0.41%(+2.92)#7 |
| 9. | Freemansburg Borough | 3.11% | 0.24%(+2.87)#7 | 0.41%(+2.70)#8 |
| 10. | Colonial Park | 2.69% | 0.24%(+2.45)#8 | 0.41%(+2.29)#9 |
| 11. | Millbourne Borough | 2.60% | 0.24%(+2.35)#46 | 0.41%(+2.19)#1,145 |
| 12. | Lightstreet | 2.54% | 0.24%(+2.30)#47 | 0.41%(+2.13)#1,146 |
| 13. | Rutledge Borough | 2.54% | 0.24%(+2.30)#48 | 0.41%(+2.13)#1,147 |
| 14. | Northwest Harborcreek | 2.37% | 0.24%(+2.13)#49 | 0.41%(+1.97)#1,148 |
| 15. | Landisburg Borough | 2.35% | 0.24%(+2.11)#50 | 0.41%(+1.95)#1,149 |
| 16. | Rutherford | 2.07% | 0.24%(+1.83)#51 | 0.41%(+1.66)#1,150 |
| 17. | Lawnton | 1.70% | 0.24%(+1.46)#52 | 0.41%(+1.30)#1,151 |
| 18. | Mcelhattan | 1.56% | 0.24%(+1.32)#53 | 0.41%(+1.16)#1,152 |
| 19. | Cementon | 1.54% | 0.24%(+1.30)#54 | 0.41%(+1.13)#1,153 |
| 20. | Villanova | 1.51% | 0.24%(+1.27)#55 | 0.41%(+1.10)#1,154 |
| 21. | Telford Borough | 1.48% | 0.24%(+1.23)#56 | 0.41%(+1.07)#1,155 |
| 22. | Gettysburg Borough | 1.45% | 0.24%(+1.21)#57 | 0.41%(+1.05)#1,156 |
| 23. | Spring House | 1.45% | 0.24%(+1.20)#58 | 0.41%(+1.04)#1,157 |
| 24. | Mount Pleasant Mills | 1.40% | 0.24%(+1.16)#59 | 0.41%(+0.991)#1,158 |
| 25. | Rupert | 1.36% | 0.24%(+1.12)#60 | 0.41%(+0.956)#1,159 |
| 26. | Progress | 1.34% | 0.24%(+1.09)#61 | 0.41%(+0.930)#1,160 |
| 27. | Scottdale Borough | 1.32% | 0.24%(+1.08)#62 | 0.41%(+0.911)#1,161 |
| 28. | Pocono Ranch Lands | 1.31% | 0.24%(+1.07)#63 | 0.41%(+0.906)#1,162 |
| 29. | Lansdale Borough | 1.28% | 0.24%(+1.04)#83 | 0.41%(+0.874)#2,625 |
| 30. | Muse | 1.28% | 0.24%(+1.04)#84 | 0.41%(+0.872)#2,626 |
| 31. | Souderton Borough | 1.27% | 0.24%(+1.03)#85 | 0.41%(+0.862)#2,627 |
| 32. | Old Orchard | 1.26% | 0.24%(+1.02)#86 | 0.41%(+0.852)#2,628 |
| 33. | Salunga | 1.25% | 0.24%(+1.01)#87 | 0.41%(+0.845)#2,629 |
| 34. | Shamokin Dam Borough | 1.20% | 0.24%(+0.960)#88 | 0.41%(+0.795)#2,630 |
| 35. | Forest City Borough | 1.18% | 0.24%(+0.936)#89 | 0.41%(+0.771)#2,631 |
| 36. | West Reading Borough | 1.17% | 0.24%(+0.926)#90 | 0.41%(+0.762)#2,632 |
| 37. | West Grove Borough | 1.15% | 0.24%(+0.907)#91 | 0.41%(+0.742)#2,633 |
| 38. | East Vandergrift Borough | 1.14% | 0.24%(+0.898)#92 | 0.41%(+0.734)#2,634 |
| 39. | New Hope Borough | 1.11% | 0.24%(+0.862)#93 | 0.41%(+0.698)#2,635 |
| 40. | Grantley | 1.09% | 0.24%(+0.850)#94 | 0.41%(+0.686)#2,636 |
| 41. | Larksville Borough | 1.08% | 0.24%(+0.842)#95 | 0.41%(+0.677)#2,637 |
| 42. | Hokendauqua | 1.08% | 0.24%(+0.838)#96 | 0.41%(+0.673)#2,638 |
| 43. | Trooper | 1.02% | 0.24%(+0.779)#97 | 0.41%(+0.615)#2,639 |
| 44. | Sugar Notch Borough | 0.98% | 0.24%(+0.739)#98 | 0.41%(+0.574)#2,640 |
| 45. | Sweden Valley | 0.98% | 0.24%(+0.738)#99 | 0.41%(+0.573)#2,641 |
| 46. | Denver Borough | 0.98% | 0.24%(+0.734)#100 | 0.41%(+0.569)#2,642 |
| 47. | East Lansdowne Borough | 0.96% | 0.24%(+0.719)#101 | 0.41%(+0.554)#2,643 |
| 48. | Wayne | 0.96% | 0.24%(+0.717)#102 | 0.41%(+0.552)#2,644 |
| 49. | Womelsdorf Borough | 0.94% | 0.24%(+0.694)#103 | 0.41%(+0.529)#2,645 |
| 50. | Muhlenberg Park | 0.94% | 0.24%(+0.693)#104 | 0.41%(+0.528)#2,646 |
| 51. | Halfway House | 0.93% | 0.24%(+0.692)#105 | 0.41%(+0.527)#2,647 |
| 52. | Carbondale | 0.93% | 0.24%(+0.687)#106 | 0.41%(+0.522)#2,648 |
| 53. | Broomall | 0.93% | 0.24%(+0.686)#107 | 0.41%(+0.521)#2,649 |
| 54. | Matamoras Borough | 0.92% | 0.24%(+0.675)#108 | 0.41%(+0.511)#2,650 |
| 55. | Springmont | 0.91% | 0.24%(+0.670)#109 | 0.41%(+0.505)#2,651 |
| 56. | New Britain Borough | 0.88% | 0.24%(+0.636)#110 | 0.41%(+0.471)#2,652 |
| 57. | Woodlyn | 0.86% | 0.24%(+0.617)#111 | 0.41%(+0.453)#2,653 |
| 58. | Thorndale | 0.82% | 0.24%(+0.581)#112 | 0.41%(+0.416)#2,654 |
| 59. | Penn Wynne | 0.82% | 0.24%(+0.573)#113 | 0.41%(+0.408)#2,655 |
| 60. | Aldan Borough | 0.80% | 0.24%(+0.562)#114 | 0.41%(+0.397)#2,656 |
| 61. | Shiremanstown Borough | 0.80% | 0.24%(+0.557)#115 | 0.41%(+0.392)#2,657 |
| 62. | Catawissa Borough | 0.79% | 0.24%(+0.550)#116 | 0.41%(+0.385)#2,658 |
| 63. | Audubon | 0.79% | 0.24%(+0.545)#117 | 0.41%(+0.380)#2,659 |
| 64. | Ingram Borough | 0.78% | 0.24%(+0.533)#118 | 0.41%(+0.368)#2,660 |
| 65. | East Side Borough | 0.77% | 0.24%(+0.529)#119 | 0.41%(+0.365)#2,661 |
| 66. | Maple Glen | 0.77% | 0.24%(+0.526)#120 | 0.41%(+0.361)#2,662 |
| 67. | Espy | 0.77% | 0.24%(+0.522)#121 | 0.41%(+0.358)#2,663 |
| 68. | Philadelphia | 0.76% | 0.24%(+0.515)#122 | 0.41%(+0.350)#2,664 |
| 69. | Downingtown Borough | 0.72% | 0.24%(+0.474)#123 | 0.41%(+0.309)#2,665 |
| 70. | Frazer | 0.70% | 0.24%(+0.461)#124 | 0.41%(+0.296)#2,666 |
| 71. | Hatfield Borough | 0.69% | 0.24%(+0.445)#125 | 0.41%(+0.280)#2,667 |
| 72. | Riverview Park | 0.65% | 0.24%(+0.410)#126 | 0.41%(+0.245)#2,668 |
| 73. | King Of Prussia | 0.64% | 0.24%(+0.400)#127 | 0.41%(+0.235)#2,669 |
| 74. | Lansdowne Borough | 0.63% | 0.24%(+0.391)#128 | 0.41%(+0.226)#2,670 |
| 75. | Montgomery Borough | 0.63% | 0.24%(+0.391)#129 | 0.41%(+0.226)#2,671 |
| 76. | Nazareth Borough | 0.63% | 0.24%(+0.389)#130 | 0.41%(+0.224)#2,672 |
| 77. | Croydon | 0.63% | 0.24%(+0.383)#131 | 0.41%(+0.218)#2,673 |
| 78. | Emigsville | 0.62% | 0.24%(+0.381)#132 | 0.41%(+0.216)#2,674 |
| 79. | Montgomeryville | 0.62% | 0.24%(+0.380)#133 | 0.41%(+0.215)#2,675 |
| 80. | Lancaster | 0.60% | 0.24%(+0.357)#134 | 0.41%(+0.193)#2,676 |
| 81. | Parkside Borough | 0.58% | 0.24%(+0.342)#135 | 0.41%(+0.177)#2,677 |
| 82. | Carroll Valley Borough | 0.58% | 0.24%(+0.340)#136 | 0.41%(+0.175)#2,678 |
| 83. | Drexel Hill | 0.55% | 0.24%(+0.305)#137 | 0.41%(+0.140)#2,679 |
| 84. | Phoenixville Borough | 0.52% | 0.24%(+0.281)#138 | 0.41%(+0.116)#2,680 |
| 85. | Willow Grove | 0.52% | 0.24%(+0.280)#139 | 0.41%(+0.116)#2,681 |
| 86. | Plymouth Meeting | 0.52% | 0.24%(+0.275)#140 | 0.41%(+0.110)#2,682 |
| 87. | West Decatur | 0.51% | 0.24%(+0.270)#141 | 0.41%(+0.105)#2,683 |
| 88. | Harleysville | 0.51% | 0.24%(+0.269)#142 | 0.41%(+0.104)#2,684 |
| 89. | Millville Borough | 0.50% | 0.24%(+0.257)#143 | 0.41%(+0.092)#2,685 |
| 90. | Quakertown Borough | 0.48% | 0.24%(+0.241)#144 | 0.41%(+0.076)#2,686 |
| 91. | Merion Station | 0.48% | 0.24%(+0.239)#145 | 0.41%(+0.074)#2,687 |
| 92. | North York Borough | 0.46% | 0.24%(+0.221)#146 | 0.41%(+0.056)#2,688 |
| 93. | Great Bend Borough | 0.45% | 0.24%(+0.203)#147 | 0.41%(+0.038)#2,689 |
| 94. | Mohnton Borough | 0.44% | 0.24%(+0.202)#148 | 0.41%(+0.037)#2,690 |
| 95. | Shippensburg Borough | 0.44% | 0.24%(+0.197)#149 | 0.41%(+0.032)#2,691 |
| 96. | Huntingdon Borough | 0.43% | 0.24%(+0.192)#150 | 0.41%(+0.027)#2,692 |
| 97. | Everett Borough | 0.42% | 0.24%(+0.175)#151 | 0.41%(+0.010)#2,693 |
| 98. | Chester Heights Borough | 0.41% | 0.24%(+0.171)#152 | 0.41%(+0.007)#2,694 |
| 99. | New Stanton Borough | 0.41% | 0.24%(+0.168)#153 | 0.41%(+0.003)#2,695 |
| 100. | Port Carbon Borough | 0.40% | 0.24%(+0.158)#154 | 0.41%(-0.007)#2,696 |
Common Questions
What are the Top 10 Cities with the Highest Percentage of Immigrants from Vietnam in Pennsylvania?
Top 10 Cities with the Highest Percentage of Immigrants from Vietnam in Pennsylvania are:
#1
6.90%
#2
6.05%
#3
5.41%
#4
4.95%
#5
2.69%
#6
2.54%
#7
2.37%
#8
2.07%
#9
1.70%
#10
1.56%
What city has the Highest Percentage of Immigrants from Vietnam in Pennsylvania?
Fountain Springs has the Highest Percentage of Immigrants from Vietnam in Pennsylvania with 6.90%.
What is the Percentage of Immigrants from Vietnam in the State of Pennsylvania?
Percentage of Immigrants from Vietnam in Pennsylvania is 0.24%.
What is the Percentage of Immigrants from Vietnam in the United States?
Percentage of Immigrants from Vietnam in the United States is 0.41%.