Cities with the Highest Percentage of Immigrants from South Central Asia in Wisconsin
RELATED REPORTS & OPTIONS
South Central Asia
Wisconsin
Compare Cities
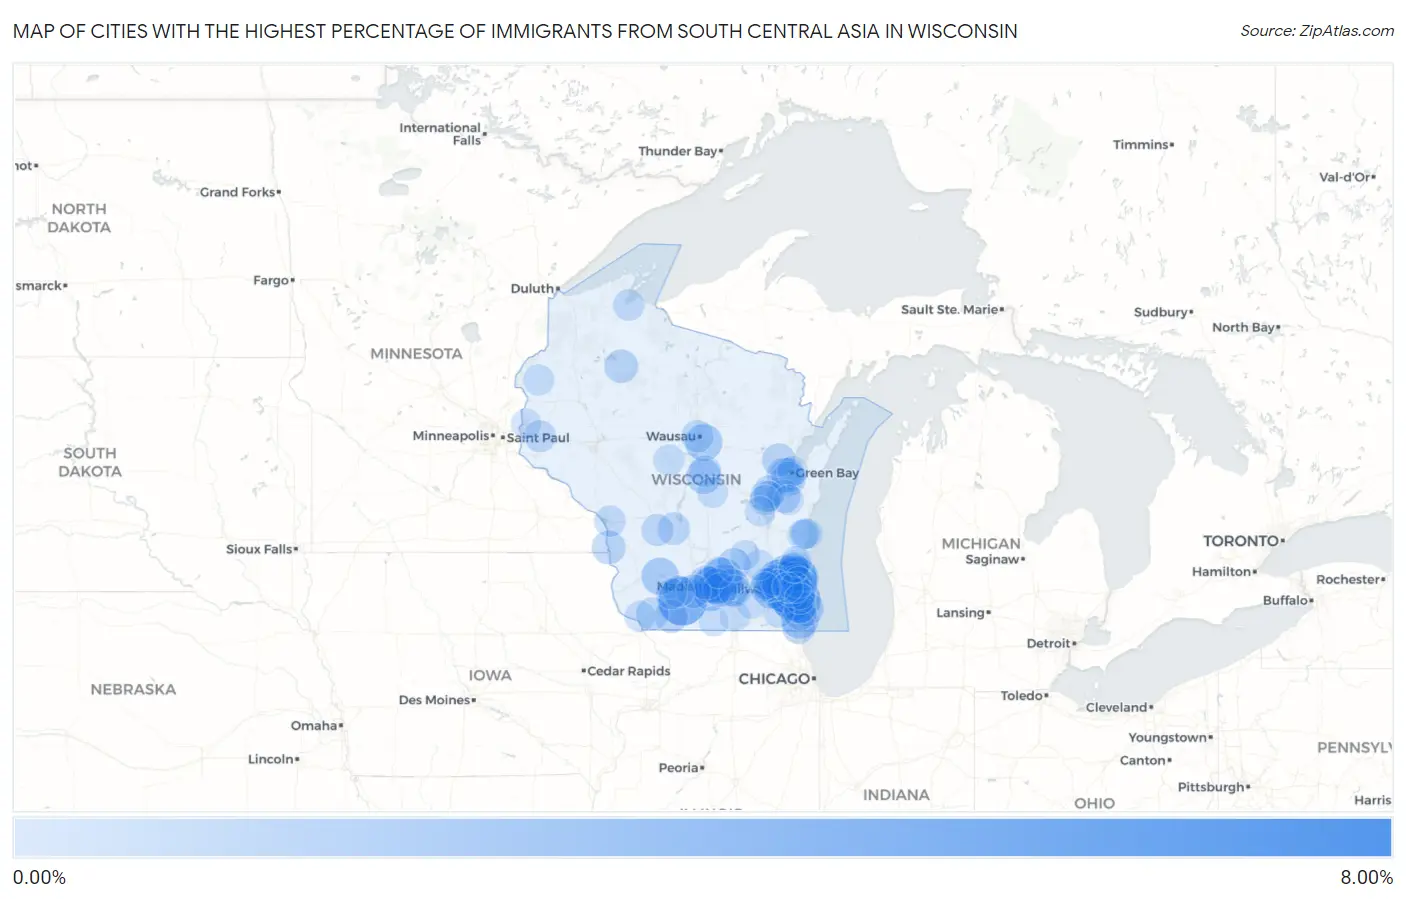
Map of Cities with the Highest Percentage of Immigrants from South Central Asia in Wisconsin
0.00%
8.00%
Cities with the Highest Percentage of Immigrants from South Central Asia in Wisconsin
| City | South Central Asia | vs State | vs National | |
| 1. | Paac Ciinak | 7.58% | 0.53%(+7.05)#1 | 1.31%(+6.27)#271 |
| 2. | Brookfield | 4.78% | 0.53%(+4.26)#2 | 1.31%(+3.48)#563 |
| 3. | Hollandale | 4.56% | 0.53%(+4.03)#3 | 1.31%(+3.25)#599 |
| 4. | Greendale | 3.81% | 0.53%(+3.29)#4 | 1.31%(+2.50)#776 |
| 5. | River Hills | 3.66% | 0.53%(+3.13)#5 | 1.31%(+2.35)#828 |
| 6. | Oak Creek | 3.54% | 0.53%(+3.01)#6 | 1.31%(+2.23)#860 |
| 7. | Sussex | 3.41% | 0.53%(+2.89)#7 | 1.31%(+2.10)#902 |
| 8. | Franklin | 2.94% | 0.53%(+2.42)#8 | 1.31%(+1.64)#1,090 |
| 9. | Sun Prairie | 2.47% | 0.53%(+1.94)#9 | 1.31%(+1.16)#1,318 |
| 10. | Bayside | 2.40% | 0.53%(+1.87)#10 | 1.31%(+1.09)#1,361 |
| 11. | Cottage Grove | 2.31% | 0.53%(+1.79)#11 | 1.31%(+1.00)#1,407 |
| 12. | Menomonee Falls | 2.17% | 0.53%(+1.65)#12 | 1.31%(+0.865)#1,499 |
| 13. | Thiensville | 2.07% | 0.53%(+1.55)#13 | 1.31%(+0.766)#1,577 |
| 14. | Lannon | 2.07% | 0.53%(+1.55)#14 | 1.31%(+0.764)#1,578 |
| 15. | New Berlin | 2.05% | 0.53%(+1.52)#15 | 1.31%(+0.742)#1,597 |
| 16. | Somers | 1.96% | 0.53%(+1.44)#16 | 1.31%(+0.655)#1,672 |
| 17. | Madison | 1.96% | 0.53%(+1.44)#17 | 1.31%(+0.653)#1,675 |
| 18. | Deerfield | 1.95% | 0.53%(+1.42)#18 | 1.31%(+0.640)#1,690 |
| 19. | Avoca | 1.93% | 0.53%(+1.40)#19 | 1.31%(+0.619)#1,706 |
| 20. | Weston | 1.90% | 0.53%(+1.37)#20 | 1.31%(+0.590)#1,724 |
| 21. | Fitchburg | 1.84% | 0.53%(+1.32)#21 | 1.31%(+0.536)#1,777 |
| 22. | Fox Point | 1.84% | 0.53%(+1.31)#22 | 1.31%(+0.527)#1,785 |
| 23. | Germantown | 1.81% | 0.53%(+1.29)#23 | 1.31%(+0.507)#1,799 |
| 24. | Shorewood | 1.75% | 0.53%(+1.23)#24 | 1.31%(+0.443)#1,861 |
| 25. | Shorewood Hills | 1.68% | 0.53%(+1.15)#25 | 1.31%(+0.371)#1,935 |
| 26. | Greenfield | 1.61% | 0.53%(+1.08)#26 | 1.31%(+0.299)#2,026 |
| 27. | Hartland | 1.52% | 0.53%(+0.995)#27 | 1.31%(+0.213)#2,132 |
| 28. | Monona | 1.50% | 0.53%(+0.976)#28 | 1.31%(+0.193)#2,159 |
| 29. | Plover | 1.46% | 0.53%(+0.936)#29 | 1.31%(+0.153)#2,215 |
| 30. | Wales | 1.42% | 0.53%(+0.898)#30 | 1.31%(+0.116)#2,266 |
| 31. | Wind Point | 1.42% | 0.53%(+0.896)#31 | 1.31%(+0.114)#2,269 |
| 32. | Hobart | 1.25% | 0.53%(+0.728)#32 | 1.31%(-0.054)#2,480 |
| 33. | Nashotah | 1.23% | 0.53%(+0.708)#33 | 1.31%(-0.075)#2,504 |
| 34. | Ashwaubenon | 1.22% | 0.53%(+0.697)#34 | 1.31%(-0.086)#2,523 |
| 35. | De Pere | 1.21% | 0.53%(+0.684)#35 | 1.31%(-0.098)#2,547 |
| 36. | Middleton | 1.19% | 0.53%(+0.664)#36 | 1.31%(-0.119)#2,585 |
| 37. | Wauwatosa | 1.16% | 0.53%(+0.639)#37 | 1.31%(-0.144)#2,635 |
| 38. | Mcfarland | 1.13% | 0.53%(+0.606)#38 | 1.31%(-0.177)#2,686 |
| 39. | Greenville | 1.12% | 0.53%(+0.590)#39 | 1.31%(-0.193)#2,719 |
| 40. | Genoa | 1.12% | 0.53%(+0.590)#40 | 1.31%(-0.193)#2,720 |
| 41. | Columbus | 1.11% | 0.53%(+0.587)#41 | 1.31%(-0.195)#2,727 |
| 42. | Mount Horeb | 1.09% | 0.53%(+0.563)#42 | 1.31%(-0.220)#2,767 |
| 43. | Mequon | 1.09% | 0.53%(+0.562)#43 | 1.31%(-0.221)#2,773 |
| 44. | Winter | 1.08% | 0.53%(+0.558)#44 | 1.31%(-0.225)#2,781 |
| 45. | Pulaski | 1.06% | 0.53%(+0.536)#45 | 1.31%(-0.246)#2,821 |
| 46. | Darlington | 1.02% | 0.53%(+0.490)#46 | 1.31%(-0.293)#2,913 |
| 47. | Forest Junction | 1.01% | 0.53%(+0.489)#47 | 1.31%(-0.294)#2,917 |
| 48. | Butler | 1.00% | 0.53%(+0.471)#48 | 1.31%(-0.311)#2,952 |
| 49. | Pleasant Prairie | 0.95% | 0.53%(+0.429)#49 | 1.31%(-0.354)#3,030 |
| 50. | Platteville | 0.94% | 0.53%(+0.419)#50 | 1.31%(-0.364)#3,059 |
| 51. | Mount Pleasant | 0.90% | 0.53%(+0.372)#51 | 1.31%(-0.411)#3,159 |
| 52. | Mauston | 0.88% | 0.53%(+0.356)#52 | 1.31%(-0.427)#3,195 |
| 53. | Brown Deer | 0.85% | 0.53%(+0.324)#53 | 1.31%(-0.458)#3,271 |
| 54. | Wausau | 0.85% | 0.53%(+0.321)#54 | 1.31%(-0.461)#3,282 |
| 55. | Grafton | 0.83% | 0.53%(+0.305)#55 | 1.31%(-0.477)#3,322 |
| 56. | Appleton | 0.80% | 0.53%(+0.277)#56 | 1.31%(-0.505)#3,379 |
| 57. | Kendall | 0.77% | 0.53%(+0.248)#57 | 1.31%(-0.535)#3,455 |
| 58. | Fox Crossing | 0.77% | 0.53%(+0.240)#58 | 1.31%(-0.543)#3,482 |
| 59. | Glendale | 0.75% | 0.53%(+0.223)#59 | 1.31%(-0.560)#3,528 |
| 60. | Hammond | 0.69% | 0.53%(+0.169)#60 | 1.31%(-0.613)#3,693 |
| 61. | Cambridge | 0.69% | 0.53%(+0.168)#61 | 1.31%(-0.615)#3,704 |
| 62. | West Allis | 0.67% | 0.53%(+0.144)#62 | 1.31%(-0.639)#3,770 |
| 63. | Stevens Point | 0.67% | 0.53%(+0.144)#63 | 1.31%(-0.639)#3,771 |
| 64. | Caledonia | 0.67% | 0.53%(+0.143)#64 | 1.31%(-0.639)#3,774 |
| 65. | Ridgeway | 0.64% | 0.53%(+0.113)#65 | 1.31%(-0.669)#3,870 |
| 66. | Ashland | 0.63% | 0.53%(+0.107)#66 | 1.31%(-0.675)#3,889 |
| 67. | Onalaska | 0.61% | 0.53%(+0.085)#67 | 1.31%(-0.698)#3,953 |
| 68. | Windsor | 0.58% | 0.53%(+0.057)#68 | 1.31%(-0.726)#4,053 |
| 69. | Oconomowoc Lake | 0.58% | 0.53%(+0.053)#69 | 1.31%(-0.729)#4,062 |
| 70. | Whitefish Bay | 0.55% | 0.53%(+0.028)#70 | 1.31%(-0.754)#4,138 |
| 71. | Marshfield | 0.55% | 0.53%(+0.028)#71 | 1.31%(-0.755)#4,142 |
| 72. | Frederic | 0.54% | 0.53%(+0.019)#72 | 1.31%(-0.763)#4,175 |
| 73. | Tennyson | 0.53% | 0.53%(+0.009)#73 | 1.31%(-0.773)#4,206 |
| 74. | Dodgeville | 0.50% | 0.53%(-0.025)#74 | 1.31%(-0.807)#4,334 |
| 75. | Sheboygan | 0.47% | 0.53%(-0.060)#75 | 1.31%(-0.842)#4,488 |
| 76. | St Francis | 0.46% | 0.53%(-0.063)#76 | 1.31%(-0.845)#4,503 |
| 77. | Merton | 0.46% | 0.53%(-0.063)#77 | 1.31%(-0.846)#4,507 |
| 78. | Pewaukee | 0.46% | 0.53%(-0.064)#78 | 1.31%(-0.846)#4,509 |
| 79. | Hustisford | 0.46% | 0.53%(-0.068)#79 | 1.31%(-0.851)#4,529 |
| 80. | Almond | 0.45% | 0.53%(-0.075)#80 | 1.31%(-0.858)#4,561 |
| 81. | Milwaukee | 0.45% | 0.53%(-0.076)#81 | 1.31%(-0.859)#4,568 |
| 82. | Menasha | 0.43% | 0.53%(-0.095)#82 | 1.31%(-0.878)#4,656 |
| 83. | Summit | 0.43% | 0.53%(-0.098)#83 | 1.31%(-0.881)#4,661 |
| 84. | New Munster | 0.43% | 0.53%(-0.100)#84 | 1.31%(-0.883)#4,669 |
| 85. | Janesville | 0.41% | 0.53%(-0.120)#85 | 1.31%(-0.903)#4,757 |
| 86. | Sheboygan Falls | 0.40% | 0.53%(-0.121)#86 | 1.31%(-0.904)#4,760 |
| 87. | South Milwaukee | 0.40% | 0.53%(-0.124)#87 | 1.31%(-0.907)#4,776 |
| 88. | Saukville | 0.40% | 0.53%(-0.128)#88 | 1.31%(-0.910)#4,798 |
| 89. | Green Bay | 0.40% | 0.53%(-0.130)#89 | 1.31%(-0.912)#4,807 |
| 90. | Rochester | 0.37% | 0.53%(-0.155)#90 | 1.31%(-0.937)#4,910 |
| 91. | Brillion | 0.36% | 0.53%(-0.161)#91 | 1.31%(-0.944)#4,937 |
| 92. | Neenah | 0.36% | 0.53%(-0.167)#92 | 1.31%(-0.949)#4,966 |
| 93. | Cedarburg | 0.34% | 0.53%(-0.182)#93 | 1.31%(-0.964)#5,048 |
| 94. | Whitewater | 0.34% | 0.53%(-0.182)#94 | 1.31%(-0.965)#5,051 |
| 95. | Beaver Dam | 0.34% | 0.53%(-0.183)#95 | 1.31%(-0.966)#5,060 |
| 96. | Brodhead | 0.34% | 0.53%(-0.184)#96 | 1.31%(-0.967)#5,065 |
| 97. | Oshkosh | 0.33% | 0.53%(-0.193)#97 | 1.31%(-0.975)#5,115 |
| 98. | Somerset | 0.33% | 0.53%(-0.196)#98 | 1.31%(-0.978)#5,132 |
| 99. | Kohler | 0.33% | 0.53%(-0.199)#99 | 1.31%(-0.981)#5,143 |
| 100. | Elm Grove | 0.33% | 0.53%(-0.200)#100 | 1.31%(-0.982)#5,149 |
Common Questions
What are the Top 10 Cities with the Highest Percentage of Immigrants from South Central Asia in Wisconsin?
Top 10 Cities with the Highest Percentage of Immigrants from South Central Asia in Wisconsin are:
#1
4.78%
#2
4.56%
#3
3.81%
#4
3.66%
#5
3.54%
#6
3.41%
#7
2.94%
#8
2.47%
#9
2.40%
#10
2.31%
What city has the Highest Percentage of Immigrants from South Central Asia in Wisconsin?
Brookfield has the Highest Percentage of Immigrants from South Central Asia in Wisconsin with 4.78%.
What is the Percentage of Immigrants from South Central Asia in the State of Wisconsin?
Percentage of Immigrants from South Central Asia in Wisconsin is 0.53%.
What is the Percentage of Immigrants from South Central Asia in the United States?
Percentage of Immigrants from South Central Asia in the United States is 1.31%.