Cities with the Highest Percentage of Immigrants from South Central Asia in Mississippi
RELATED REPORTS & OPTIONS
South Central Asia
Mississippi
Compare Cities
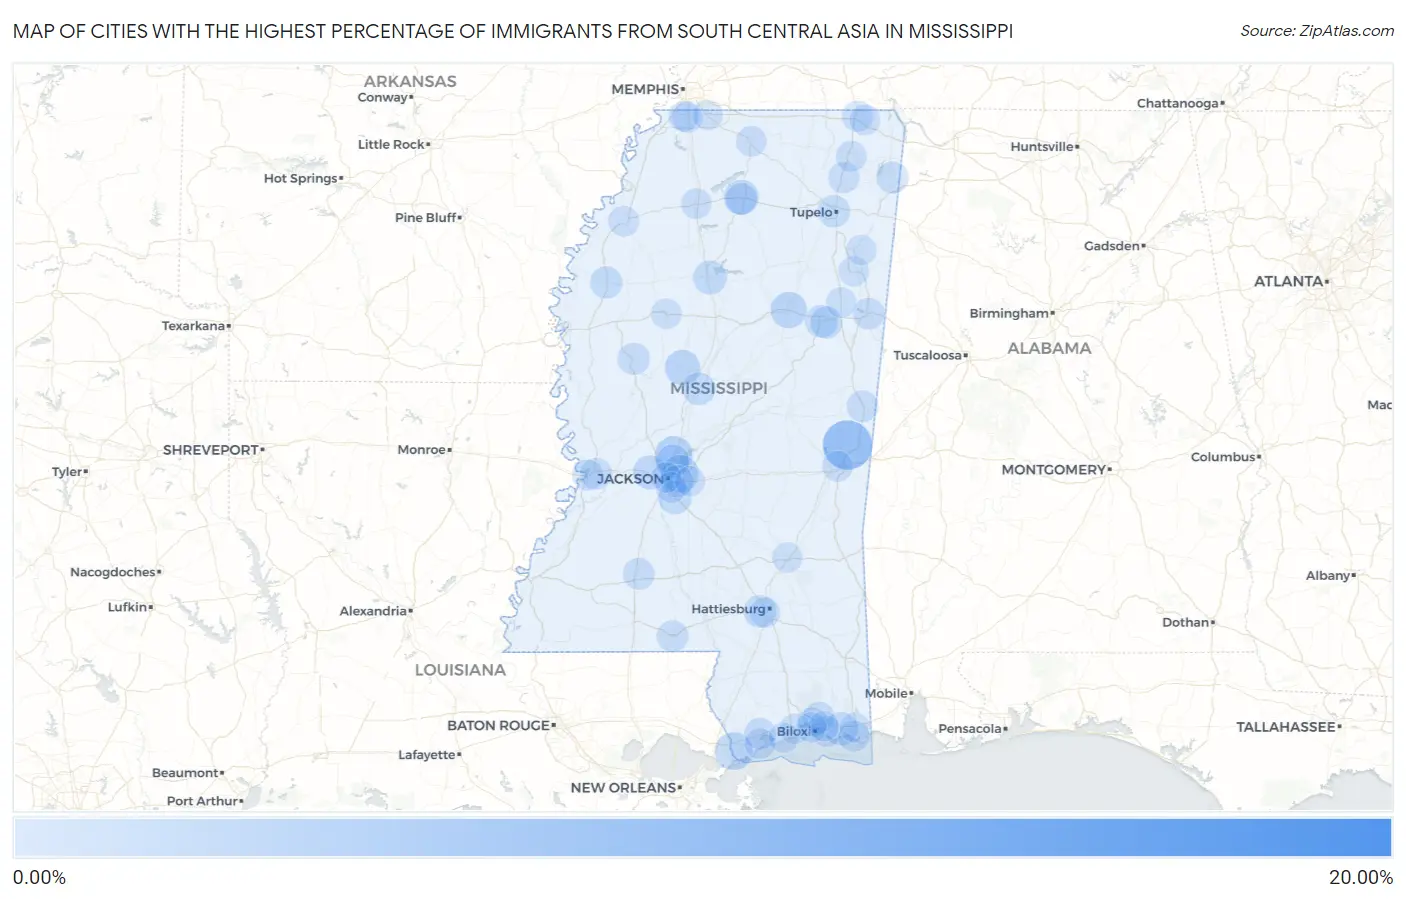
Map of Cities with the Highest Percentage of Immigrants from South Central Asia in Mississippi
0.00%
20.00%
Cities with the Highest Percentage of Immigrants from South Central Asia in Mississippi
| City | South Central Asia | vs State | vs National | |
| 1. | Bolivar | 16.33% | 0.20%(+16.1)#1 | 1.31%(+15.0)#59 |
| 2. | Meridian Station | 6.28% | 0.20%(+6.09)#2 | 1.31%(+4.98)#361 |
| 3. | Lakeview | 4.06% | 0.20%(+3.86)#3 | 1.31%(+2.75)#707 |
| 4. | Pearlington | 2.49% | 0.20%(+2.29)#4 | 1.31%(+1.18)#1,298 |
| 5. | Madison | 2.44% | 0.20%(+2.25)#5 | 1.31%(+1.13)#1,337 |
| 6. | Flowood | 2.29% | 0.20%(+2.10)#6 | 1.31%(+0.985)#1,418 |
| 7. | Mathiston | 1.98% | 0.20%(+1.79)#7 | 1.31%(+0.675)#1,656 |
| 8. | Lexington | 1.65% | 0.20%(+1.45)#8 | 1.31%(+0.338)#1,976 |
| 9. | University | 1.56% | 0.20%(+1.37)#9 | 1.31%(+0.254)#2,088 |
| 10. | Clinton | 1.30% | 0.20%(+1.10)#10 | 1.31%(-0.011)#2,424 |
| 11. | Grenada | 1.19% | 0.20%(+0.994)#11 | 1.31%(-0.117)#2,581 |
| 12. | Gautier | 1.10% | 0.20%(+0.908)#12 | 1.31%(-0.203)#2,737 |
| 13. | Florence | 1.09% | 0.20%(+0.891)#13 | 1.31%(-0.220)#2,770 |
| 14. | Ridgeland | 1.03% | 0.20%(+0.835)#14 | 1.31%(-0.276)#2,883 |
| 15. | Goodman | 0.85% | 0.20%(+0.658)#15 | 1.31%(-0.453)#3,258 |
| 16. | West Hattiesburg | 0.83% | 0.20%(+0.638)#16 | 1.31%(-0.474)#3,312 |
| 17. | Starkville | 0.77% | 0.20%(+0.570)#17 | 1.31%(-0.542)#3,476 |
| 18. | Cleveland | 0.71% | 0.20%(+0.516)#18 | 1.31%(-0.595)#3,629 |
| 19. | Tupelo | 0.69% | 0.20%(+0.491)#19 | 1.31%(-0.620)#3,719 |
| 20. | Belzoni | 0.67% | 0.20%(+0.471)#20 | 1.31%(-0.640)#3,778 |
| 21. | Mississippi State | 0.66% | 0.20%(+0.463)#21 | 1.31%(-0.649)#3,805 |
| 22. | Pearl | 0.63% | 0.20%(+0.438)#22 | 1.31%(-0.673)#3,881 |
| 23. | Belmont | 0.61% | 0.20%(+0.417)#23 | 1.31%(-0.694)#3,945 |
| 24. | Diamondhead | 0.50% | 0.20%(+0.306)#24 | 1.31%(-0.806)#4,329 |
| 25. | Brookhaven | 0.48% | 0.20%(+0.281)#25 | 1.31%(-0.830)#4,425 |
| 26. | Columbus | 0.47% | 0.20%(+0.276)#26 | 1.31%(-0.835)#4,460 |
| 27. | Tylertown | 0.47% | 0.20%(+0.273)#27 | 1.31%(-0.838)#4,466 |
| 28. | Gluckstadt | 0.47% | 0.20%(+0.270)#28 | 1.31%(-0.841)#4,481 |
| 29. | Latimer | 0.47% | 0.20%(+0.270)#29 | 1.31%(-0.842)#4,487 |
| 30. | Beechwood | 0.46% | 0.20%(+0.265)#30 | 1.31%(-0.847)#4,515 |
| 31. | Oxford | 0.45% | 0.20%(+0.255)#31 | 1.31%(-0.857)#4,559 |
| 32. | Scooba | 0.42% | 0.20%(+0.222)#32 | 1.31%(-0.890)#4,697 |
| 33. | Baldwyn | 0.38% | 0.20%(+0.181)#33 | 1.31%(-0.930)#4,882 |
| 34. | Ocean Springs | 0.35% | 0.20%(+0.151)#34 | 1.31%(-0.961)#5,031 |
| 35. | Pascagoula | 0.33% | 0.20%(+0.132)#35 | 1.31%(-0.979)#5,134 |
| 36. | Meridian | 0.27% | 0.20%(+0.078)#36 | 1.31%(-1.03)#5,419 |
| 37. | Booneville | 0.25% | 0.20%(+0.058)#37 | 1.31%(-1.05)#5,554 |
| 38. | Vicksburg | 0.22% | 0.20%(+0.028)#38 | 1.31%(-1.08)#5,743 |
| 39. | Bay St Louis | 0.21% | 0.20%(+0.018)#39 | 1.31%(-1.09)#5,835 |
| 40. | Corinth | 0.20% | 0.20%(+0.003)#40 | 1.31%(-1.11)#5,933 |
| 41. | Southaven | 0.20% | 0.20%(+0.002)#41 | 1.31%(-1.11)#5,946 |
| 42. | Richland | 0.17% | 0.20%(-0.030)#42 | 1.31%(-1.14)#6,151 |
| 43. | Clarksdale | 0.16% | 0.20%(-0.034)#43 | 1.31%(-1.15)#6,180 |
| 44. | Farmington | 0.16% | 0.20%(-0.039)#44 | 1.31%(-1.15)#6,206 |
| 45. | Horn Lake | 0.16% | 0.20%(-0.039)#45 | 1.31%(-1.15)#6,209 |
| 46. | Batesville | 0.15% | 0.20%(-0.049)#46 | 1.31%(-1.16)#6,283 |
| 47. | Holly Springs | 0.14% | 0.20%(-0.053)#47 | 1.31%(-1.16)#6,310 |
| 48. | Hattiesburg | 0.12% | 0.20%(-0.079)#48 | 1.31%(-1.19)#6,490 |
| 49. | Greenwood | 0.11% | 0.20%(-0.091)#49 | 1.31%(-1.20)#6,577 |
| 50. | Aberdeen | 0.10% | 0.20%(-0.096)#50 | 1.31%(-1.21)#6,613 |
| 51. | Jackson | 0.095% | 0.20%(-0.102)#51 | 1.31%(-1.21)#6,655 |
| 52. | Gulfport | 0.090% | 0.20%(-0.107)#52 | 1.31%(-1.22)#6,699 |
| 53. | D Iberville | 0.085% | 0.20%(-0.111)#53 | 1.31%(-1.22)#6,726 |
| 54. | Laurel | 0.075% | 0.20%(-0.121)#54 | 1.31%(-1.23)#6,776 |
| 55. | West Point | 0.070% | 0.20%(-0.127)#55 | 1.31%(-1.24)#6,816 |
| 56. | Olive Branch | 0.067% | 0.20%(-0.129)#56 | 1.31%(-1.24)#6,829 |
| 57. | Amory | 0.060% | 0.20%(-0.136)#57 | 1.31%(-1.25)#6,884 |
| 58. | Biloxi | 0.055% | 0.20%(-0.142)#58 | 1.31%(-1.25)#6,925 |
| 59. | Long Beach | 0.054% | 0.20%(-0.143)#59 | 1.31%(-1.25)#6,931 |
| 60. | Brandon | 0.024% | 0.20%(-0.173)#60 | 1.31%(-1.28)#7,085 |
| 61. | Gulf Hills | 0.012% | 0.20%(-0.185)#61 | 1.31%(-1.30)#7,137 |
| 62. | Moss Point | 0.0082% | 0.20%(-0.188)#62 | 1.31%(-1.30)#7,145 |
Common Questions
What are the Top 10 Cities with the Highest Percentage of Immigrants from South Central Asia in Mississippi?
Top 10 Cities with the Highest Percentage of Immigrants from South Central Asia in Mississippi are:
#1
6.28%
#2
2.49%
#3
2.44%
#4
2.29%
#5
1.98%
#6
1.65%
#7
1.56%
#8
1.30%
#9
1.19%
#10
1.10%
What city has the Highest Percentage of Immigrants from South Central Asia in Mississippi?
Meridian Station has the Highest Percentage of Immigrants from South Central Asia in Mississippi with 6.28%.
What is the Percentage of Immigrants from South Central Asia in the State of Mississippi?
Percentage of Immigrants from South Central Asia in Mississippi is 0.20%.
What is the Percentage of Immigrants from South Central Asia in the United States?
Percentage of Immigrants from South Central Asia in the United States is 1.31%.