Cities with the Highest Percentage of Immigrants from South Central Asia in Pennsylvania
RELATED REPORTS & OPTIONS
South Central Asia
Pennsylvania
Compare Cities
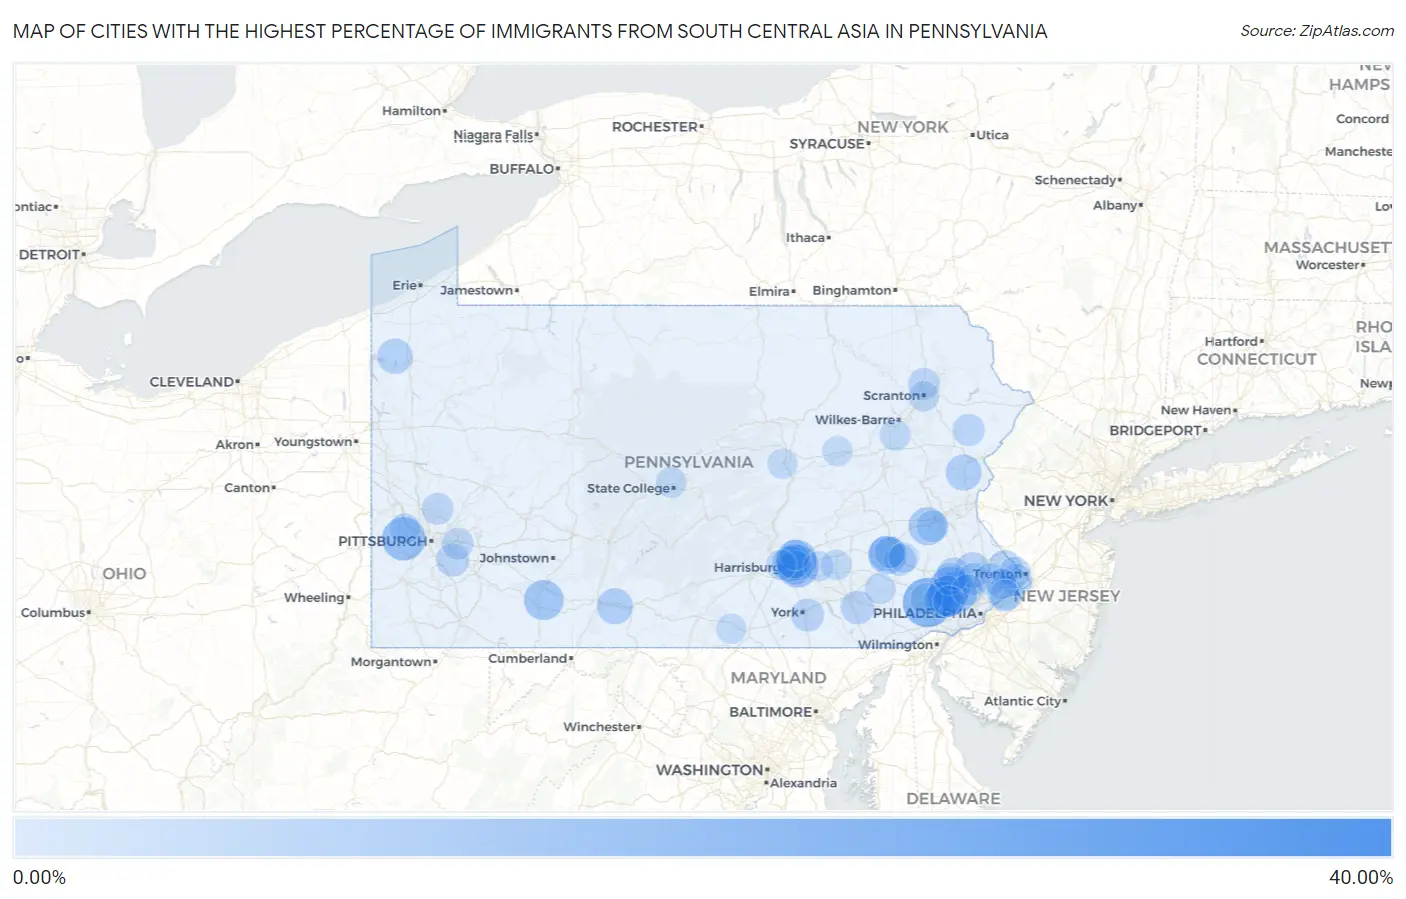
Map of Cities with the Highest Percentage of Immigrants from South Central Asia in Pennsylvania
0.00%
40.00%
Cities with the Highest Percentage of Immigrants from South Central Asia in Pennsylvania
| City | South Central Asia | vs State | vs National | |
| 1. | Millbourne Borough | 35.30% | 1.15%(+34.1)#1 | 1.31%(+34.0)#9 |
| 2. | Frazer | 29.17% | 1.15%(+28.0)#2 | 1.31%(+27.9)#17 |
| 3. | Exton | 18.37% | 1.15%(+17.2)#3 | 1.31%(+17.1)#47 |
| 4. | Enlow | 13.36% | 1.15%(+12.2)#4 | 1.31%(+12.1)#99 |
| 5. | Hatfield Borough | 13.09% | 1.15%(+11.9)#5 | 1.31%(+11.8)#104 |
| 6. | Rutherford | 12.45% | 1.15%(+11.3)#6 | 1.31%(+11.1)#120 |
| 7. | King Of Prussia | 11.57% | 1.15%(+10.4)#7 | 1.31%(+10.3)#139 |
| 8. | Audubon | 11.55% | 1.15%(+10.4)#8 | 1.31%(+10.2)#140 |
| 9. | Paxtonia | 11.28% | 1.15%(+10.1)#9 | 1.31%(+9.97)#147 |
| 10. | Chesterbrook | 11.02% | 1.15%(+9.87)#10 | 1.31%(+9.71)#154 |
| 11. | Friedens | 10.42% | 1.15%(+9.27)#11 | 1.31%(+9.11)#167 |
| 12. | Colony Park | 9.20% | 1.15%(+8.05)#12 | 1.31%(+7.89)#201 |
| 13. | Breinigsville | 8.84% | 1.15%(+7.69)#13 | 1.31%(+7.54)#212 |
| 14. | Whitehall Borough | 8.78% | 1.15%(+7.63)#14 | 1.31%(+7.47)#217 |
| 15. | Paoli | 7.91% | 1.15%(+6.76)#15 | 1.31%(+6.60)#259 |
| 16. | Earlston | 7.21% | 1.15%(+6.06)#16 | 1.31%(+5.90)#289 |
| 17. | Saylorsburg | 7.15% | 1.15%(+6.00)#17 | 1.31%(+5.84)#292 |
| 18. | Progress | 6.96% | 1.15%(+5.81)#18 | 1.31%(+5.65)#310 |
| 19. | Eddington | 6.78% | 1.15%(+5.63)#19 | 1.31%(+5.48)#319 |
| 20. | Montgomeryville | 6.63% | 1.15%(+5.48)#20 | 1.31%(+5.32)#333 |
| 21. | Baldwin Borough | 6.62% | 1.15%(+5.47)#21 | 1.31%(+5.31)#335 |
| 22. | Eagle | 6.58% | 1.15%(+5.43)#22 | 1.31%(+5.27)#337 |
| 23. | Spring Ridge | 6.57% | 1.15%(+5.42)#23 | 1.31%(+5.26)#338 |
| 24. | Harmonsburg | 6.56% | 1.15%(+5.41)#24 | 1.31%(+5.25)#340 |
| 25. | Lansdale Borough | 6.29% | 1.15%(+5.14)#25 | 1.31%(+4.98)#359 |
| 26. | Newtown Grant | 5.91% | 1.15%(+4.77)#26 | 1.31%(+4.61)#397 |
| 27. | Lawnton | 5.85% | 1.15%(+4.70)#27 | 1.31%(+4.54)#410 |
| 28. | Colonial Park | 5.81% | 1.15%(+4.66)#28 | 1.31%(+4.51)#414 |
| 29. | Franklin Park Borough | 5.69% | 1.15%(+4.54)#29 | 1.31%(+4.38)#431 |
| 30. | Dilworthtown | 5.57% | 1.15%(+4.42)#30 | 1.31%(+4.26)#444 |
| 31. | Matamoras Borough | 5.38% | 1.15%(+4.24)#31 | 1.31%(+4.08)#470 |
| 32. | Mcadoo Borough | 5.34% | 1.15%(+4.19)#32 | 1.31%(+4.03)#475 |
| 33. | Lampeter | 5.21% | 1.15%(+4.06)#33 | 1.31%(+3.90)#496 |
| 34. | Wormleysburg Borough | 5.16% | 1.15%(+4.01)#34 | 1.31%(+3.86)#503 |
| 35. | Malvern Borough | 4.99% | 1.15%(+3.84)#35 | 1.31%(+3.68)#531 |
| 36. | Castle Shannon Borough | 4.88% | 1.15%(+3.73)#36 | 1.31%(+3.57)#548 |
| 37. | Blawnox Borough | 4.83% | 1.15%(+3.68)#37 | 1.31%(+3.52)#558 |
| 38. | Millville Borough | 4.80% | 1.15%(+3.65)#38 | 1.31%(+3.49)#562 |
| 39. | Queens Gate | 4.74% | 1.15%(+3.59)#39 | 1.31%(+3.43)#567 |
| 40. | Greenock | 4.70% | 1.15%(+3.55)#40 | 1.31%(+3.39)#576 |
| 41. | East Lansdowne Borough | 4.51% | 1.15%(+3.36)#41 | 1.31%(+3.21)#609 |
| 42. | Skippack | 4.41% | 1.15%(+3.26)#42 | 1.31%(+3.10)#632 |
| 43. | Clarks Green Borough | 4.39% | 1.15%(+3.24)#43 | 1.31%(+3.08)#636 |
| 44. | Evansburg | 4.38% | 1.15%(+3.23)#44 | 1.31%(+3.07)#637 |
| 45. | Bald Eagle | 4.35% | 1.15%(+3.20)#45 | 1.31%(+3.04)#647 |
| 46. | Downingtown Borough | 4.34% | 1.15%(+3.19)#46 | 1.31%(+3.03)#649 |
| 47. | Carlisle Barracks | 4.29% | 1.15%(+3.14)#47 | 1.31%(+2.98)#664 |
| 48. | Fairview Borough | 4.12% | 1.15%(+2.97)#48 | 1.31%(+2.82)#692 |
| 49. | Danville Borough | 4.08% | 1.15%(+2.93)#49 | 1.31%(+2.77)#701 |
| 50. | Mountainhome | 4.07% | 1.15%(+2.92)#50 | 1.31%(+2.76)#704 |
| 51. | Fairless Hills | 4.06% | 1.15%(+2.91)#51 | 1.31%(+2.75)#706 |
| 52. | Ancient Oaks | 3.90% | 1.15%(+2.75)#52 | 1.31%(+2.59)#747 |
| 53. | Middletown Borough | 3.78% | 1.15%(+2.63)#53 | 1.31%(+2.47)#784 |
| 54. | Bakerstown | 3.78% | 1.15%(+2.63)#54 | 1.31%(+2.47)#785 |
| 55. | Mckinley | 3.76% | 1.15%(+2.61)#55 | 1.31%(+2.45)#789 |
| 56. | Spring House | 3.74% | 1.15%(+2.59)#56 | 1.31%(+2.43)#796 |
| 57. | Chalfont Borough | 3.71% | 1.15%(+2.56)#57 | 1.31%(+2.40)#811 |
| 58. | Chinchilla | 3.71% | 1.15%(+2.56)#58 | 1.31%(+2.40)#814 |
| 59. | Monroeville | 3.70% | 1.15%(+2.55)#59 | 1.31%(+2.39)#817 |
| 60. | Reiffton | 3.63% | 1.15%(+2.48)#60 | 1.31%(+2.32)#834 |
| 61. | Lionville | 3.58% | 1.15%(+2.44)#61 | 1.31%(+2.28)#847 |
| 62. | Sinking Spring Borough | 3.57% | 1.15%(+2.42)#62 | 1.31%(+2.26)#851 |
| 63. | Pleasant Hills Borough | 3.50% | 1.15%(+2.35)#63 | 1.31%(+2.19)#869 |
| 64. | Warminster Heights | 3.48% | 1.15%(+2.33)#64 | 1.31%(+2.17)#876 |
| 65. | Woodside | 3.47% | 1.15%(+2.32)#65 | 1.31%(+2.16)#881 |
| 66. | Hulmeville Borough | 3.46% | 1.15%(+2.31)#66 | 1.31%(+2.15)#882 |
| 67. | Plymouth Meeting | 3.30% | 1.15%(+2.15)#67 | 1.31%(+1.99)#941 |
| 68. | Bridgewater Borough | 3.30% | 1.15%(+2.15)#68 | 1.31%(+1.99)#942 |
| 69. | Berwyn | 3.24% | 1.15%(+2.09)#69 | 1.31%(+1.94)#961 |
| 70. | Greenfields | 3.24% | 1.15%(+2.09)#70 | 1.31%(+1.93)#963 |
| 71. | Camp Hill Borough | 3.20% | 1.15%(+2.05)#71 | 1.31%(+1.89)#985 |
| 72. | Eagleville Cdp Montgomery County | 3.12% | 1.15%(+1.97)#72 | 1.31%(+1.81)#1,021 |
| 73. | Oakland Cdp Cambria County | 3.06% | 1.15%(+1.91)#73 | 1.31%(+1.75)#1,047 |
| 74. | Green Tree Borough | 3.06% | 1.15%(+1.91)#74 | 1.31%(+1.75)#1,048 |
| 75. | Mountain Top | 3.05% | 1.15%(+1.90)#75 | 1.31%(+1.75)#1,055 |
| 76. | Blue Ball | 3.05% | 1.15%(+1.90)#76 | 1.31%(+1.74)#1,059 |
| 77. | Alburtis Borough | 3.00% | 1.15%(+1.85)#77 | 1.31%(+1.69)#1,072 |
| 78. | Millersville Borough | 2.99% | 1.15%(+1.84)#78 | 1.31%(+1.68)#1,074 |
| 79. | Delaware Water Gap Borough | 2.91% | 1.15%(+1.77)#79 | 1.31%(+1.61)#1,099 |
| 80. | Toftrees | 2.86% | 1.15%(+1.71)#80 | 1.31%(+1.55)#1,122 |
| 81. | Sayre Borough | 2.84% | 1.15%(+1.69)#81 | 1.31%(+1.53)#1,126 |
| 82. | Trevose | 2.83% | 1.15%(+1.68)#82 | 1.31%(+1.52)#1,130 |
| 83. | Scranton | 2.73% | 1.15%(+1.58)#83 | 1.31%(+1.43)#1,176 |
| 84. | Greencastle Borough | 2.69% | 1.15%(+1.54)#84 | 1.31%(+1.38)#1,198 |
| 85. | Wayne | 2.68% | 1.15%(+1.53)#85 | 1.31%(+1.37)#1,204 |
| 86. | Carnot Moon | 2.68% | 1.15%(+1.53)#86 | 1.31%(+1.37)#1,206 |
| 87. | Quentin | 2.66% | 1.15%(+1.51)#87 | 1.31%(+1.35)#1,213 |
| 88. | Ivyland Borough | 2.64% | 1.15%(+1.49)#88 | 1.31%(+1.33)#1,228 |
| 89. | Cornwells Heights | 2.61% | 1.15%(+1.46)#89 | 1.31%(+1.31)#1,240 |
| 90. | Linglestown | 2.59% | 1.15%(+1.44)#90 | 1.31%(+1.29)#1,245 |
| 91. | Throop Borough | 2.56% | 1.15%(+1.41)#91 | 1.31%(+1.25)#1,260 |
| 92. | Jacksonwald | 2.55% | 1.15%(+1.40)#92 | 1.31%(+1.25)#1,264 |
| 93. | Lightstreet | 2.54% | 1.15%(+1.39)#93 | 1.31%(+1.23)#1,271 |
| 94. | Campbelltown | 2.52% | 1.15%(+1.38)#94 | 1.31%(+1.22)#1,283 |
| 95. | West Fairview | 2.48% | 1.15%(+1.33)#95 | 1.31%(+1.17)#1,304 |
| 96. | Orrtanna | 2.47% | 1.15%(+1.32)#96 | 1.31%(+1.16)#1,313 |
| 97. | State College Borough | 2.46% | 1.15%(+1.31)#97 | 1.31%(+1.15)#1,324 |
| 98. | Yatesville Borough | 2.44% | 1.15%(+1.29)#98 | 1.31%(+1.13)#1,341 |
| 99. | Linntown | 2.43% | 1.15%(+1.28)#99 | 1.31%(+1.12)#1,342 |
| 100. | Mount Pocono Borough | 2.42% | 1.15%(+1.27)#100 | 1.31%(+1.11)#1,349 |
Common Questions
What are the Top 10 Cities with the Highest Percentage of Immigrants from South Central Asia in Pennsylvania?
Top 10 Cities with the Highest Percentage of Immigrants from South Central Asia in Pennsylvania are:
#1
18.37%
#2
13.36%
#3
12.45%
#4
11.57%
#5
11.55%
#6
11.28%
#7
11.02%
#8
10.42%
#9
9.20%
#10
8.84%
What city has the Highest Percentage of Immigrants from South Central Asia in Pennsylvania?
Exton has the Highest Percentage of Immigrants from South Central Asia in Pennsylvania with 18.37%.
What is the Percentage of Immigrants from South Central Asia in the State of Pennsylvania?
Percentage of Immigrants from South Central Asia in Pennsylvania is 1.15%.
What is the Percentage of Immigrants from South Central Asia in the United States?
Percentage of Immigrants from South Central Asia in the United States is 1.31%.