Zip Codes with the Highest Percentage of Households with Income Above $100,000 in Kennewick, WA
RELATED REPORTS & OPTIONS
Household Income | $100k+
Kennewick
Compare Zip Codes
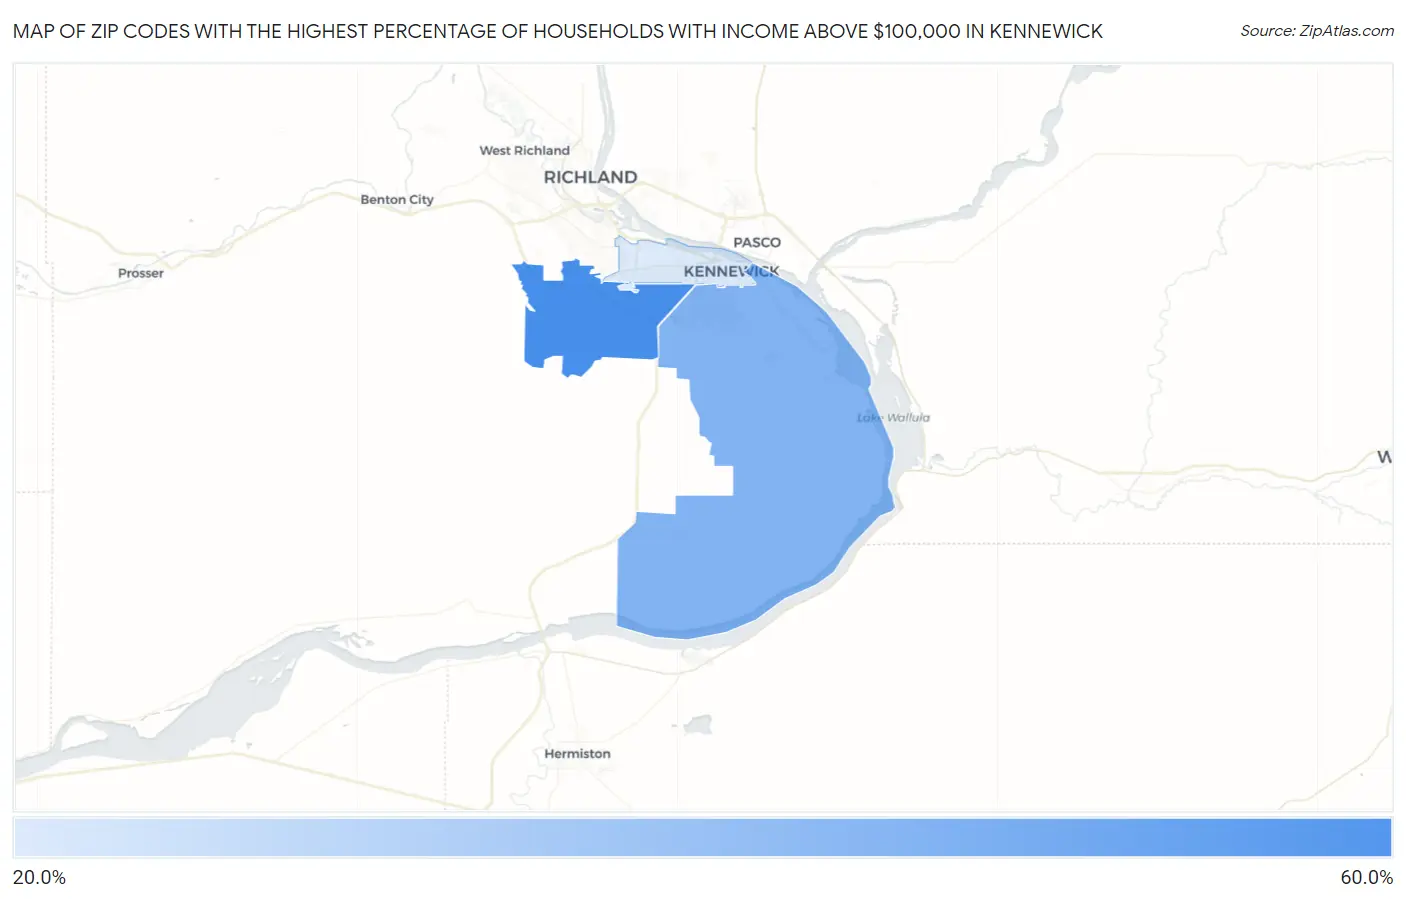
Map of Zip Codes with the Highest Percentage of Households with Income Above $100,000 in Kennewick
24.4%
57.1%
Zip Codes with the Highest Percentage of Households with Income Above $100,000 in Kennewick, WA
| Zip Code | Households with Income > $100k | vs State | vs National | |
| 1. | 99338 | 57.1% | 45.2%(+11.9)#78 | 37.3%(+19.8)#2,954 |
| 2. | 99337 | 43.8% | 45.2%(-1.40)#191 | 37.3%(+6.50)#7,080 |
| 3. | 99336 | 24.4% | 45.2%(-20.8)#451 | 37.3%(-12.9)#20,274 |
1
Common Questions
What are the Top Zip Codes with the Highest Percentage of Households with Income Above $100,000 in Kennewick, WA?
Top Zip Codes with the Highest Percentage of Households with Income Above $100,000 in Kennewick, WA are:
What zip code has the Highest Percentage of Households with Income Above $100,000 in Kennewick, WA?
99338 has the Highest Percentage of Households with Income Above $100,000 in Kennewick, WA with 57.1%.
What is the Percentage of Households with Income Above $100,000 in Kennewick, WA?
Percentage of Households with Income Above $100,000 in Kennewick is 32.6%.
What is the Percentage of Households with Income Above $100,000 in Washington?
Percentage of Households with Income Above $100,000 in Washington is 45.2%.
What is the Percentage of Households with Income Above $100,000 in the United States?
Percentage of Households with Income Above $100,000 in the United States is 37.3%.