Zip Codes with the Highest Percentage of Households with Income Above $100,000 in Seattle, WA
RELATED REPORTS & OPTIONS
Household Income | $100k+
Seattle
Compare Zip Codes
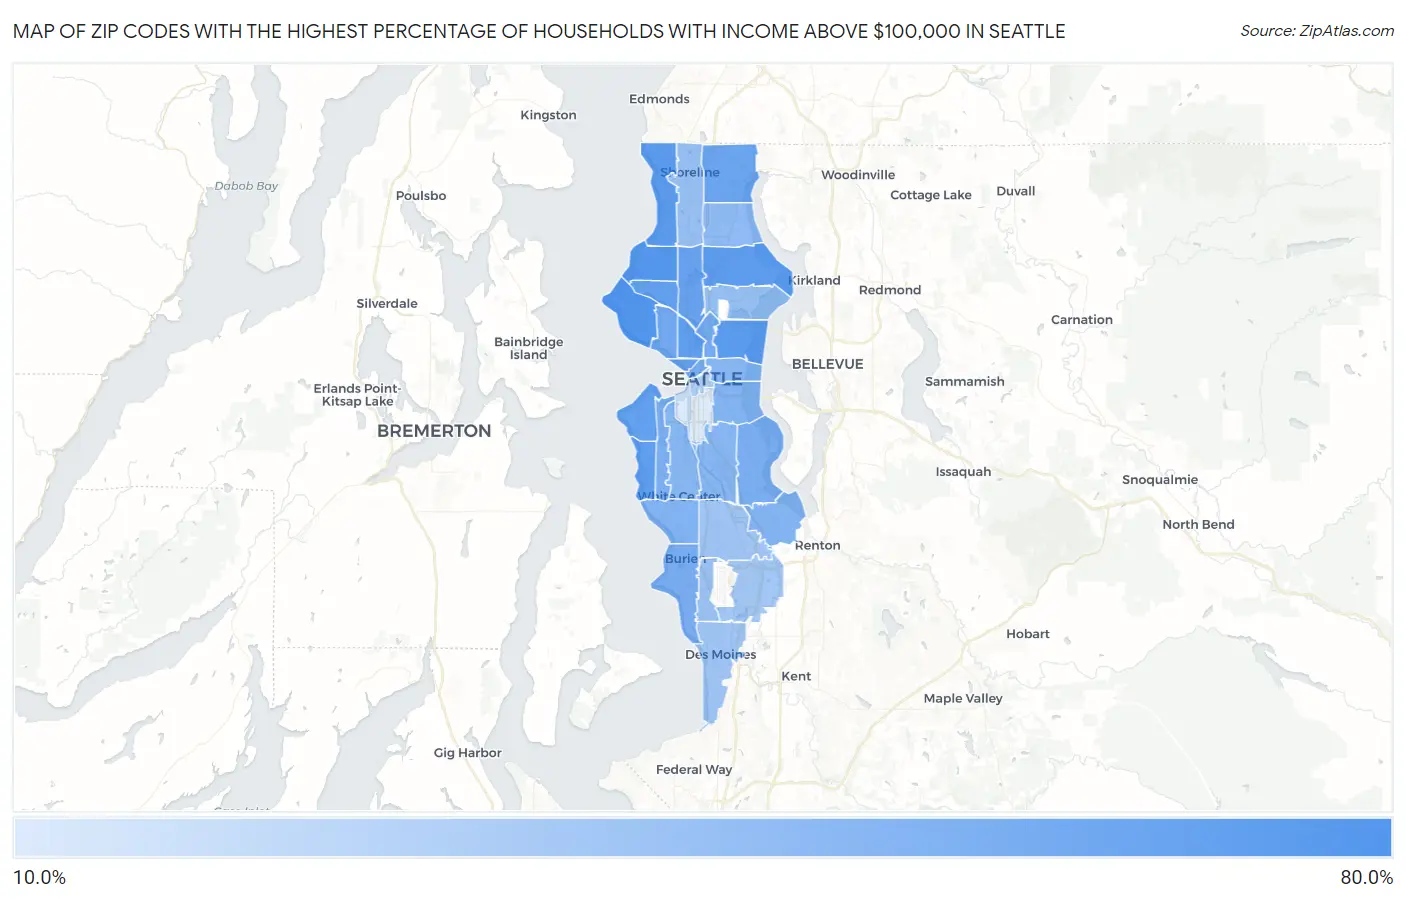
Map of Zip Codes with the Highest Percentage of Households with Income Above $100,000 in Seattle
18.0%
74.7%
Zip Codes with the Highest Percentage of Households with Income Above $100,000 in Seattle, WA
| Zip Code | Households with Income > $100k | vs State | vs National | |
| 1. | 98164 | 74.7% | 45.2%(+29.5)#12 | 37.3%(+37.4)#594 |
| 2. | 98199 | 69.0% | 45.2%(+23.8)#24 | 37.3%(+31.7)#1,055 |
| 3. | 98117 | 68.5% | 45.2%(+23.3)#25 | 37.3%(+31.2)#1,105 |
| 4. | 98177 | 66.9% | 45.2%(+21.7)#33 | 37.3%(+29.6)#1,281 |
| 5. | 98112 | 66.8% | 45.2%(+21.6)#34 | 37.3%(+29.5)#1,292 |
| 6. | 98115 | 64.6% | 45.2%(+19.4)#40 | 37.3%(+27.3)#1,588 |
| 7. | 98136 | 63.8% | 45.2%(+18.6)#41 | 37.3%(+26.5)#1,715 |
| 8. | 98109 | 63.0% | 45.2%(+17.8)#43 | 37.3%(+25.7)#1,837 |
| 9. | 98107 | 62.3% | 45.2%(+17.1)#46 | 37.3%(+25.0)#1,952 |
| 10. | 98116 | 62.1% | 45.2%(+16.9)#48 | 37.3%(+24.8)#1,982 |
| 11. | 98121 | 61.2% | 45.2%(+16.0)#53 | 37.3%(+23.9)#2,138 |
| 12. | 98103 | 60.7% | 45.2%(+15.5)#56 | 37.3%(+23.4)#2,222 |
| 13. | 98155 | 58.2% | 45.2%(+13.0)#69 | 37.3%(+20.9)#2,721 |
| 14. | 98119 | 56.2% | 45.2%(+11.0)#82 | 37.3%(+18.9)#3,152 |
| 15. | 98102 | 54.5% | 45.2%(+9.30)#91 | 37.3%(+17.2)#3,574 |
| 16. | 98101 | 53.9% | 45.2%(+8.70)#94 | 37.3%(+16.6)#3,747 |
| 17. | 98166 | 53.3% | 45.2%(+8.10)#99 | 37.3%(+16.0)#3,889 |
| 18. | 98118 | 52.9% | 45.2%(+7.70)#103 | 37.3%(+15.6)#3,979 |
| 19. | 98126 | 52.8% | 45.2%(+7.60)#104 | 37.3%(+15.5)#4,024 |
| 20. | 98146 | 50.4% | 45.2%(+5.20)#121 | 37.3%(+13.1)#4,709 |
| 21. | 98144 | 49.5% | 45.2%(+4.30)#130 | 37.3%(+12.2)#5,011 |
| 22. | 98178 | 49.3% | 45.2%(+4.10)#132 | 37.3%(+12.0)#5,083 |
| 23. | 98122 | 48.0% | 45.2%(+2.80)#146 | 37.3%(+10.7)#5,491 |
| 24. | 98106 | 47.9% | 45.2%(+2.70)#148 | 37.3%(+10.6)#5,531 |
| 25. | 98108 | 47.3% | 45.2%(+2.10)#151 | 37.3%(+10.00)#5,734 |
| 26. | 98125 | 44.8% | 45.2%(-0.400)#177 | 37.3%(+7.50)#6,693 |
| 27. | 98105 | 42.4% | 45.2%(-2.80)#208 | 37.3%(+5.10)#7,713 |
| 28. | 98133 | 41.2% | 45.2%(-4.00)#215 | 37.3%(+3.90)#8,278 |
| 29. | 98148 | 39.7% | 45.2%(-5.50)#242 | 37.3%(+2.40)#9,075 |
| 30. | 98198 | 38.3% | 45.2%(-6.90)#255 | 37.3%(+1.000)#9,806 |
| 31. | 98168 | 38.1% | 45.2%(-7.10)#257 | 37.3%(+0.800)#9,916 |
| 32. | 98188 | 37.0% | 45.2%(-8.20)#277 | 37.3%(-0.300)#10,542 |
| 33. | 98104 | 33.4% | 45.2%(-11.8)#322 | 37.3%(-3.90)#12,827 |
| 34. | 98134 | 18.0% | 45.2%(-27.2)#513 | 37.3%(-19.3)#25,584 |
1
Common Questions
What are the Top 10 Zip Codes with the Highest Percentage of Households with Income Above $100,000 in Seattle, WA?
Top 10 Zip Codes with the Highest Percentage of Households with Income Above $100,000 in Seattle, WA are:
What zip code has the Highest Percentage of Households with Income Above $100,000 in Seattle, WA?
98164 has the Highest Percentage of Households with Income Above $100,000 in Seattle, WA with 74.7%.
What is the Percentage of Households with Income Above $100,000 in Seattle, WA?
Percentage of Households with Income Above $100,000 in Seattle is 55.5%.
What is the Percentage of Households with Income Above $100,000 in Washington?
Percentage of Households with Income Above $100,000 in Washington is 45.2%.
What is the Percentage of Households with Income Above $100,000 in the United States?
Percentage of Households with Income Above $100,000 in the United States is 37.3%.