Zip Codes with the Highest Percentage of Households with Income Above $100,000 in Woodinville, WA
RELATED REPORTS & OPTIONS
Household Income | $100k+
Woodinville
Compare Zip Codes
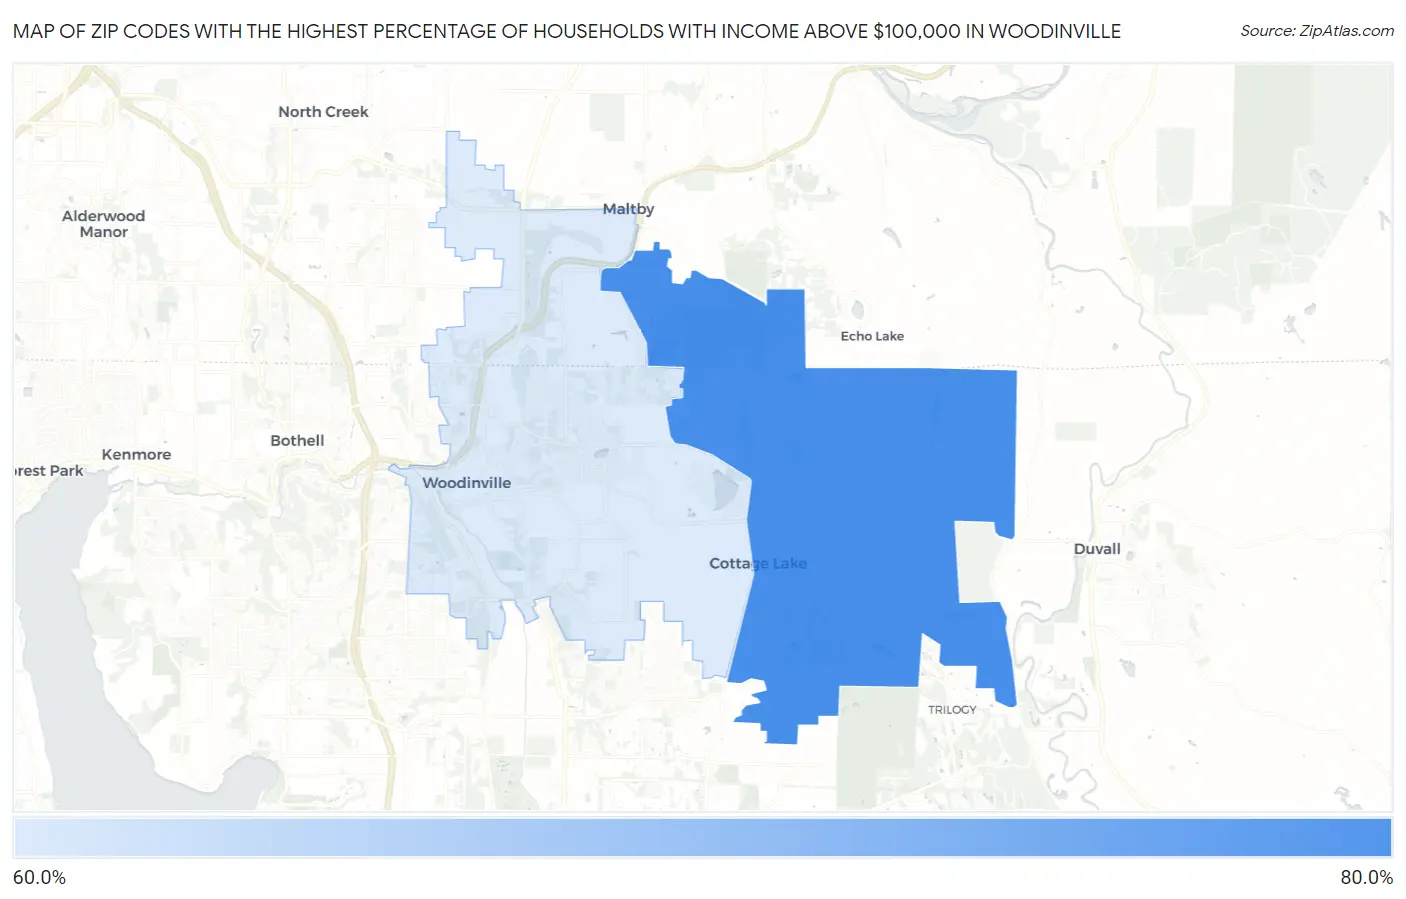
Map of Zip Codes with the Highest Percentage of Households with Income Above $100,000 in Woodinville
69.5%
77.4%
Zip Codes with the Highest Percentage of Households with Income Above $100,000 in Woodinville, WA
| Zip Code | Households with Income > $100k | vs State | vs National | |
| 1. | 98077 | 77.4% | 45.2%(+32.2)#10 | 37.3%(+40.1)#447 |
| 2. | 98072 | 69.5% | 45.2%(+24.3)#22 | 37.3%(+32.2)#1,009 |
1
Common Questions
What are the Top Zip Codes with the Highest Percentage of Households with Income Above $100,000 in Woodinville, WA?
Top Zip Codes with the Highest Percentage of Households with Income Above $100,000 in Woodinville, WA are:
What zip code has the Highest Percentage of Households with Income Above $100,000 in Woodinville, WA?
98077 has the Highest Percentage of Households with Income Above $100,000 in Woodinville, WA with 77.4%.
What is the Percentage of Households with Income Above $100,000 in Woodinville, WA?
Percentage of Households with Income Above $100,000 in Woodinville is 65.1%.
What is the Percentage of Households with Income Above $100,000 in Washington?
Percentage of Households with Income Above $100,000 in Washington is 45.2%.
What is the Percentage of Households with Income Above $100,000 in the United States?
Percentage of Households with Income Above $100,000 in the United States is 37.3%.