Zip Codes with the Highest Percentage of Households with Income Above $100,000 in Sammamish, WA
RELATED REPORTS & OPTIONS
Household Income | $100k+
Sammamish
Compare Zip Codes
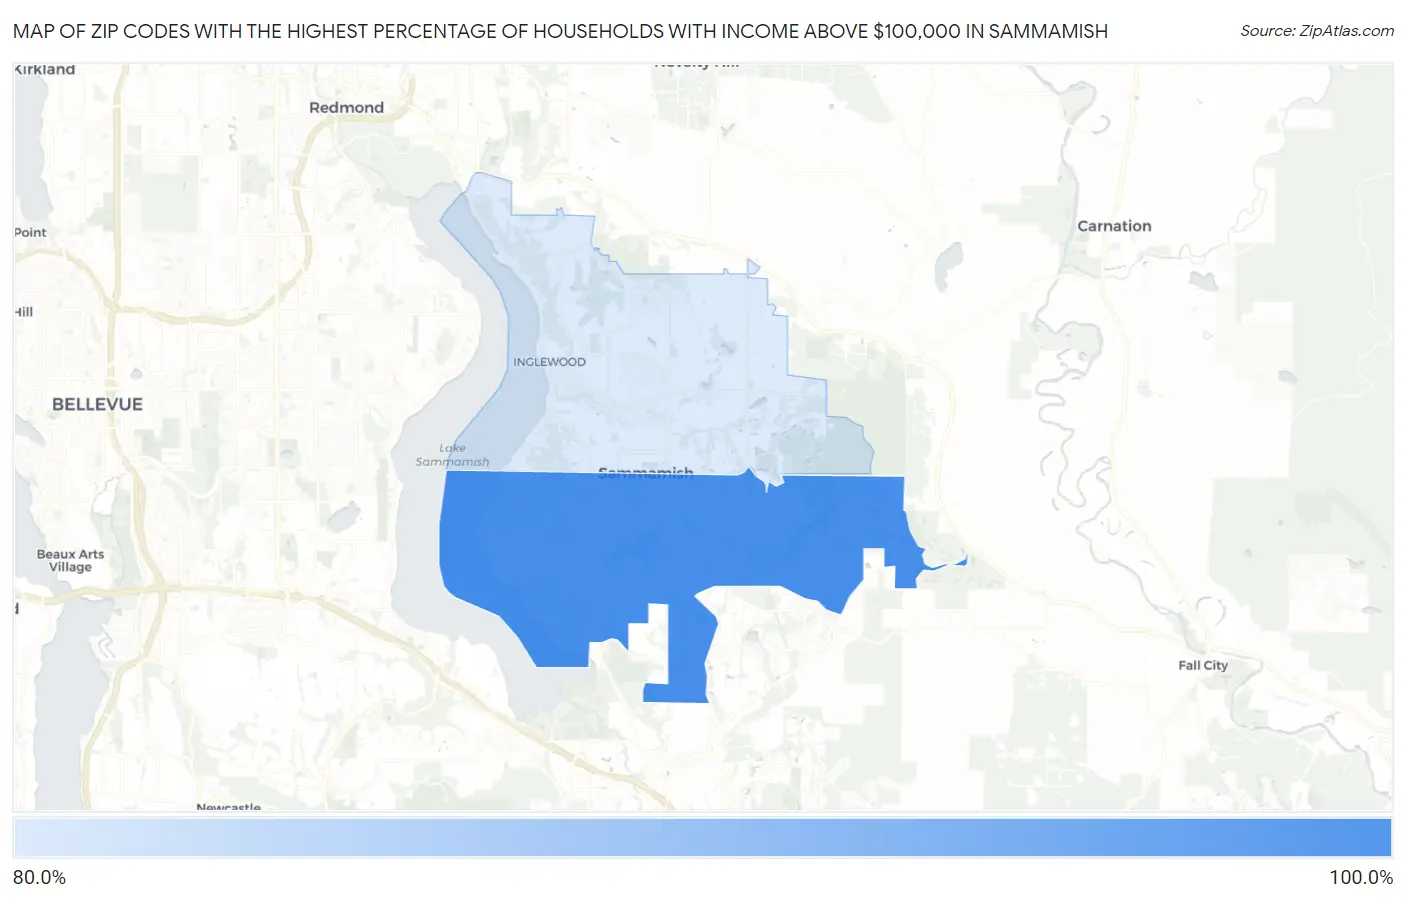
Map of Zip Codes with the Highest Percentage of Households with Income Above $100,000 in Sammamish
82.7%
88.9%
Zip Codes with the Highest Percentage of Households with Income Above $100,000 in Sammamish, WA
| Zip Code | Households with Income > $100k | vs State | vs National | |
| 1. | 98075 | 88.9% | 45.2%(+43.7)#6 | 37.3%(+51.6)#185 |
| 2. | 98074 | 82.7% | 45.2%(+37.5)#8 | 37.3%(+45.4)#265 |
1
Common Questions
What are the Top Zip Codes with the Highest Percentage of Households with Income Above $100,000 in Sammamish, WA?
Top Zip Codes with the Highest Percentage of Households with Income Above $100,000 in Sammamish, WA are:
What zip code has the Highest Percentage of Households with Income Above $100,000 in Sammamish, WA?
98075 has the Highest Percentage of Households with Income Above $100,000 in Sammamish, WA with 88.9%.
What is the Percentage of Households with Income Above $100,000 in Sammamish, WA?
Percentage of Households with Income Above $100,000 in Sammamish is 82.4%.
What is the Percentage of Households with Income Above $100,000 in Washington?
Percentage of Households with Income Above $100,000 in Washington is 45.2%.
What is the Percentage of Households with Income Above $100,000 in the United States?
Percentage of Households with Income Above $100,000 in the United States is 37.3%.