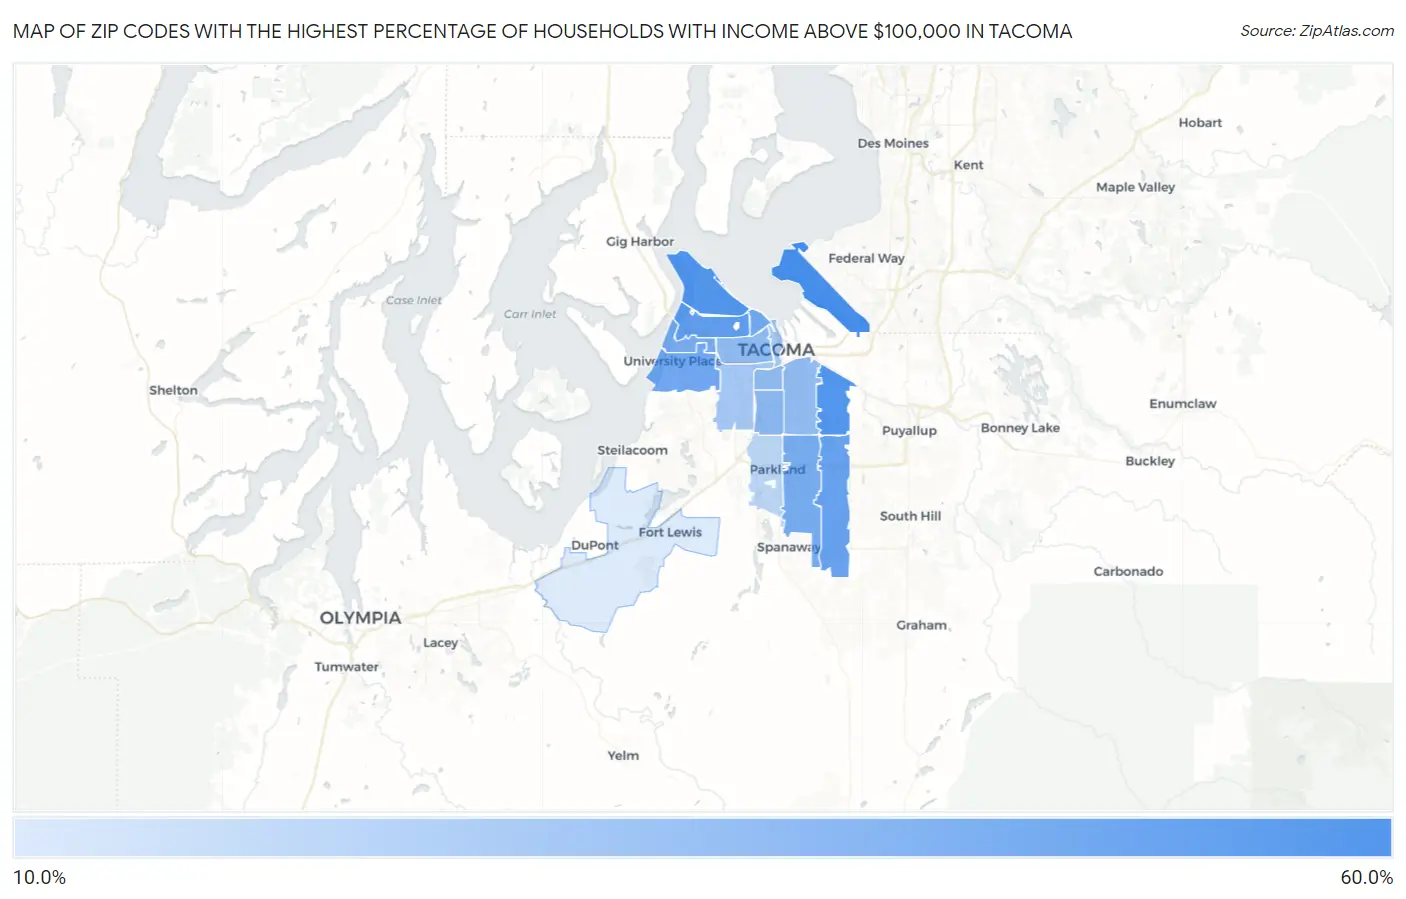
Zip Codes with the Highest Percentage of Households with Income Above $100,000 in Tacoma, WA
RELATED REPORTS & OPTIONS
Household Income | $100k+
Tacoma
Compare Zip Codes
Map of Zip Codes with the Highest Percentage of Households with Income Above $100,000 in Tacoma
14.7%
56.2%
Zip Codes with the Highest Percentage of Households with Income Above $100,000 in Tacoma, WA
| Zip Code | Households with Income > $100k | vs State | vs National | |
| 1. | 98422 | 56.2% | 45.2%(+11.0)#83 | 37.3%(+18.9)#3,154 |
| 2. | 98407 | 52.6% | 45.2%(+7.40)#105 | 37.3%(+15.3)#4,088 |
| 3. | 98443 | 52.3% | 45.2%(+7.10)#107 | 37.3%(+15.0)#4,174 |
| 4. | 98406 | 48.2% | 45.2%(+3.00)#144 | 37.3%(+10.9)#5,422 |
| 5. | 98446 | 46.1% | 45.2%(+0.900)#166 | 37.3%(+8.80)#6,168 |
| 6. | 98466 | 43.5% | 45.2%(-1.70)#193 | 37.3%(+6.20)#7,201 |
| 7. | 98403 | 43.5% | 45.2%(-1.70)#194 | 37.3%(+6.20)#7,213 |
| 8. | 98445 | 41.5% | 45.2%(-3.70)#213 | 37.3%(+4.20)#8,107 |
| 9. | 98465 | 40.7% | 45.2%(-4.50)#226 | 37.3%(+3.40)#8,560 |
| 10. | 98408 | 35.2% | 45.2%(-10.00)#298 | 37.3%(-2.10)#11,654 |
| 11. | 98405 | 34.4% | 45.2%(-10.8)#309 | 37.3%(-2.90)#12,142 |
| 12. | 98418 | 34.4% | 45.2%(-10.8)#310 | 37.3%(-2.90)#12,147 |
| 13. | 98404 | 33.3% | 45.2%(-11.9)#325 | 37.3%(-4.00)#12,872 |
| 14. | 98409 | 28.6% | 45.2%(-16.6)#386 | 37.3%(-8.70)#16,573 |
| 15. | 98402 | 28.0% | 45.2%(-17.2)#397 | 37.3%(-9.30)#17,124 |
| 16. | 98444 | 22.7% | 45.2%(-22.5)#470 | 37.3%(-14.6)#21,797 |
| 17. | 98433 | 14.7% | 45.2%(-30.5)#536 | 37.3%(-22.6)#27,720 |
1
Common Questions
What are the Top 10 Zip Codes with the Highest Percentage of Households with Income Above $100,000 in Tacoma, WA?
Top 10 Zip Codes with the Highest Percentage of Households with Income Above $100,000 in Tacoma, WA are:
What zip code has the Highest Percentage of Households with Income Above $100,000 in Tacoma, WA?
98422 has the Highest Percentage of Households with Income Above $100,000 in Tacoma, WA with 56.2%.
What is the Percentage of Households with Income Above $100,000 in Tacoma, WA?
Percentage of Households with Income Above $100,000 in Tacoma is 38.8%.
What is the Percentage of Households with Income Above $100,000 in Washington?
Percentage of Households with Income Above $100,000 in Washington is 45.2%.
What is the Percentage of Households with Income Above $100,000 in the United States?
Percentage of Households with Income Above $100,000 in the United States is 37.3%.