Cities with the Most Immigrants from Europe in South Dakota
RELATED REPORTS & OPTIONS
Europe
South Dakota
Compare Cities
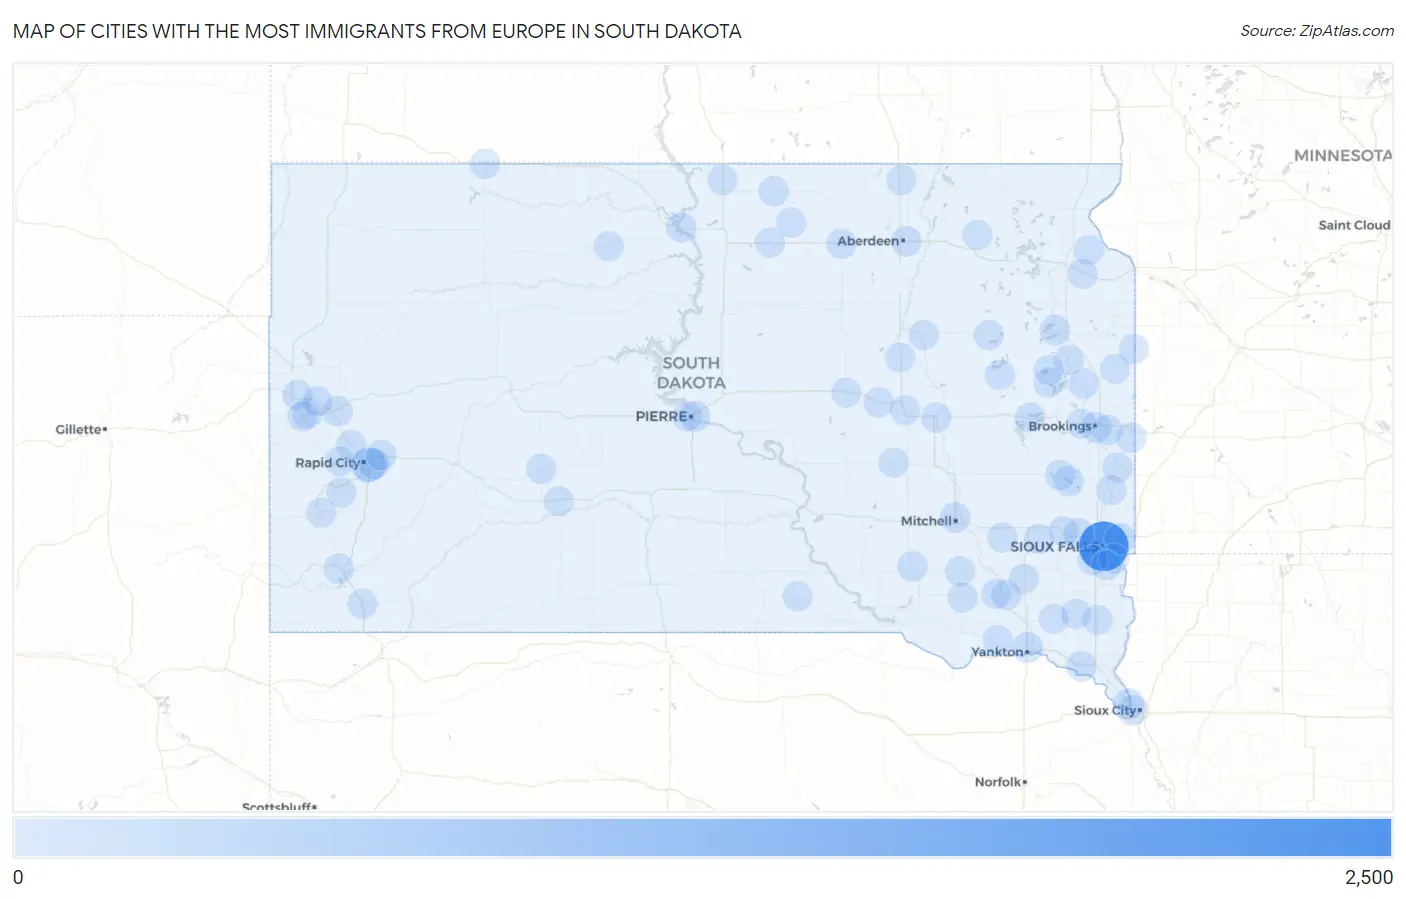
Map of Cities with the Most Immigrants from Europe in South Dakota
0
2,500
Cities with the Most Immigrants from Europe in South Dakota
| City | Europe | vs State | vs National | |
| 1. | Sioux Falls | 2,063 | 4,204(49.07%)#1 | 4,820,287(0.04%)#289 |
| 2. | Rapid City | 447 | 4,204(10.63%)#2 | 4,820,287(0.01%)#1,507 |
| 3. | Brandon | 120 | 4,204(2.85%)#3 | 4,820,287(0.00%)#3,790 |
| 4. | Rapid Valley | 77 | 4,204(1.83%)#4 | 4,820,287(0.00%)#4,797 |
| 5. | Yankton | 76 | 4,204(1.81%)#5 | 4,820,287(0.00%)#4,825 |
| 6. | North Sioux City | 67 | 4,204(1.59%)#6 | 4,820,287(0.00%)#5,121 |
| 7. | Pierre | 65 | 4,204(1.55%)#7 | 4,820,287(0.00%)#5,163 |
| 8. | Hartford | 62 | 4,204(1.47%)#8 | 4,820,287(0.00%)#5,291 |
| 9. | Brookings | 52 | 4,204(1.24%)#9 | 4,820,287(0.00%)#5,706 |
| 10. | Aberdeen | 51 | 4,204(1.21%)#10 | 4,820,287(0.00%)#5,760 |
| 11. | Box Elder | 49 | 4,204(1.17%)#11 | 4,820,287(0.00%)#5,870 |
| 12. | Vermillion | 43 | 4,204(1.02%)#12 | 4,820,287(0.00%)#6,215 |
| 13. | Watertown | 38 | 4,204(0.90%)#13 | 4,820,287(0.00%)#6,532 |
| 14. | Dakota Dunes | 34 | 4,204(0.81%)#14 | 4,820,287(0.00%)#6,879 |
| 15. | Sturgis | 32 | 4,204(0.76%)#15 | 4,820,287(0.00%)#7,016 |
| 16. | Mountain Plains | 32 | 4,204(0.76%)#16 | 4,820,287(0.00%)#7,066 |
| 17. | Mitchell | 30 | 4,204(0.71%)#17 | 4,820,287(0.00%)#7,150 |
| 18. | Lake Madison | 26 | 4,204(0.62%)#18 | 4,820,287(0.00%)#7,588 |
| 19. | Tea | 23 | 4,204(0.55%)#19 | 4,820,287(0.00%)#7,825 |
| 20. | Corsica | 21 | 4,204(0.50%)#20 | 4,820,287(0.00%)#8,180 |
| 21. | Aurora | 19 | 4,204(0.45%)#21 | 4,820,287(0.00%)#8,435 |
| 22. | Harrisburg | 17 | 4,204(0.40%)#22 | 4,820,287(0.00%)#8,657 |
| 23. | Fort Pierre | 17 | 4,204(0.40%)#23 | 4,820,287(0.00%)#8,707 |
| 24. | Shindler | 17 | 4,204(0.40%)#24 | 4,820,287(0.00%)#8,783 |
| 25. | Madison | 15 | 4,204(0.36%)#25 | 4,820,287(0.00%)#8,981 |
| 26. | Hot Springs | 15 | 4,204(0.36%)#26 | 4,820,287(0.00%)#9,024 |
| 27. | Mobridge | 15 | 4,204(0.36%)#27 | 4,820,287(0.00%)#9,028 |
| 28. | Huron | 14 | 4,204(0.33%)#28 | 4,820,287(0.00%)#9,164 |
| 29. | Deadwood | 14 | 4,204(0.33%)#29 | 4,820,287(0.00%)#9,290 |
| 30. | Eureka | 14 | 4,204(0.33%)#30 | 4,820,287(0.00%)#9,313 |
| 31. | Ipswich | 11 | 4,204(0.26%)#31 | 4,820,287(0.00%)#9,955 |
| 32. | Summerset | 9 | 4,204(0.21%)#32 | 4,820,287(0.00%)#10,381 |
| 33. | Estelline | 9 | 4,204(0.21%)#33 | 4,820,287(0.00%)#10,512 |
| 34. | Philip | 9 | 4,204(0.21%)#34 | 4,820,287(0.00%)#10,563 |
| 35. | Canistota | 8 | 4,204(0.19%)#35 | 4,820,287(0.00%)#10,840 |
| 36. | Beresford | 7 | 4,204(0.17%)#36 | 4,820,287(0.00%)#11,018 |
| 37. | Parkston | 7 | 4,204(0.17%)#37 | 4,820,287(0.00%)#11,041 |
| 38. | Elkton | 7 | 4,204(0.17%)#38 | 4,820,287(0.00%)#11,158 |
| 39. | Johnson Siding | 7 | 4,204(0.17%)#39 | 4,820,287(0.00%)#11,176 |
| 40. | Spearfish | 6 | 4,204(0.14%)#40 | 4,820,287(0.00%)#11,282 |
| 41. | Kadoka | 6 | 4,204(0.14%)#41 | 4,820,287(0.00%)#11,609 |
| 42. | Wilmot | 6 | 4,204(0.14%)#42 | 4,820,287(0.00%)#11,615 |
| 43. | Volga | 5 | 4,204(0.12%)#43 | 4,820,287(0.00%)#11,798 |
| 44. | Centerville | 5 | 4,204(0.12%)#44 | 4,820,287(0.00%)#11,930 |
| 45. | Humboldt | 5 | 4,204(0.12%)#45 | 4,820,287(0.00%)#11,980 |
| 46. | Herreid | 5 | 4,204(0.12%)#46 | 4,820,287(0.00%)#11,987 |
| 47. | Flandreau | 4 | 4,204(0.10%)#47 | 4,820,287(0.00%)#12,162 |
| 48. | Custer | 4 | 4,204(0.10%)#48 | 4,820,287(0.00%)#12,180 |
| 49. | Freeman | 4 | 4,204(0.10%)#49 | 4,820,287(0.00%)#12,237 |
| 50. | Castlewood | 4 | 4,204(0.10%)#50 | 4,820,287(0.00%)#12,394 |
| 51. | Tripp | 4 | 4,204(0.10%)#51 | 4,820,287(0.00%)#12,438 |
| 52. | Gregory | 3 | 4,204(0.07%)#52 | 4,820,287(0.00%)#12,730 |
| 53. | Clark | 3 | 4,204(0.07%)#53 | 4,820,287(0.00%)#12,767 |
| 54. | Whitewood | 3 | 4,204(0.07%)#54 | 4,820,287(0.00%)#12,854 |
| 55. | Lake Norden | 3 | 4,204(0.07%)#55 | 4,820,287(0.00%)#12,898 |
| 56. | Irene | 3 | 4,204(0.07%)#56 | 4,820,287(0.00%)#12,981 |
| 57. | Bowdle | 3 | 4,204(0.07%)#57 | 4,820,287(0.00%)#13,045 |
| 58. | Frankfort | 3 | 4,204(0.07%)#58 | 4,820,287(0.00%)#13,135 |
| 59. | Lemmon | 2 | 4,204(0.05%)#59 | 4,820,287(0.00%)#13,314 |
| 60. | Menno | 2 | 4,204(0.05%)#60 | 4,820,287(0.00%)#13,390 |
| 61. | Lake Preston | 2 | 4,204(0.05%)#61 | 4,820,287(0.00%)#13,578 |
| 62. | Emery | 2 | 4,204(0.05%)#62 | 4,820,287(0.00%)#13,623 |
| 63. | Tabor | 2 | 4,204(0.05%)#63 | 4,820,287(0.00%)#13,693 |
| 64. | Willow Lake | 2 | 4,204(0.05%)#64 | 4,820,287(0.00%)#13,731 |
| 65. | Hosmer | 2 | 4,204(0.05%)#65 | 4,820,287(0.00%)#13,808 |
| 66. | Oelrichs | 2 | 4,204(0.05%)#66 | 4,820,287(0.00%)#13,861 |
| 67. | Wessington | 2 | 4,204(0.05%)#67 | 4,820,287(0.00%)#13,870 |
| 68. | Tulare | 2 | 4,204(0.05%)#68 | 4,820,287(0.00%)#13,884 |
| 69. | Pierpont | 2 | 4,204(0.05%)#69 | 4,820,287(0.00%)#13,933 |
| 70. | Central City | 2 | 4,204(0.05%)#70 | 4,820,287(0.00%)#13,935 |
| 71. | Marvin | 2 | 4,204(0.05%)#71 | 4,820,287(0.00%)#13,959 |
| 72. | Miller | 1 | 4,204(0.02%)#72 | 4,820,287(0.00%)#14,037 |
| 73. | Wolsey | 1 | 4,204(0.02%)#73 | 4,820,287(0.00%)#14,096 |
| 74. | Wessington Springs | 1 | 4,204(0.02%)#74 | 4,820,287(0.00%)#14,111 |
| 75. | Timber Lake | 1 | 4,204(0.02%)#75 | 4,820,287(0.00%)#14,122 |
| 76. | Keystone | 1 | 4,204(0.02%)#76 | 4,820,287(0.00%)#14,209 |
| 77. | Hayti | 1 | 4,204(0.02%)#77 | 4,820,287(0.00%)#14,219 |
| 78. | Trent | 1 | 4,204(0.02%)#78 | 4,820,287(0.00%)#14,246 |
| 79. | Gary | 1 | 4,204(0.02%)#79 | 4,820,287(0.00%)#14,315 |
| 80. | Frederick | 1 | 4,204(0.02%)#80 | 4,820,287(0.00%)#14,337 |
| 81. | Brandt | 1 | 4,204(0.02%)#81 | 4,820,287(0.00%)#14,410 |
| 82. | Olivet | 1 | 4,204(0.02%)#82 | 4,820,287(0.00%)#14,458 |
1
2Common Questions
What are the Top 10 Cities with the Most Immigrants from Europe in South Dakota?
Top 10 Cities with the Most Immigrants from Europe in South Dakota are:
#1
2,063
#2
447
#3
120
#4
77
#5
76
#6
67
#7
65
#8
62
#9
52
#10
51
What city has the Most Immigrants from Europe in South Dakota?
Sioux Falls has the Most Immigrants from Europe in South Dakota with 2,063.
What is the Total Immigrants from Europe in the State of South Dakota?
Total Immigrants from Europe in South Dakota is 4,204.
What is the Total Immigrants from Europe in the United States?
Total Immigrants from Europe in the United States is 4,820,287.