Cities with the Most Immigrants from Europe in Vermont
RELATED REPORTS & OPTIONS
Europe
Vermont
Compare Cities
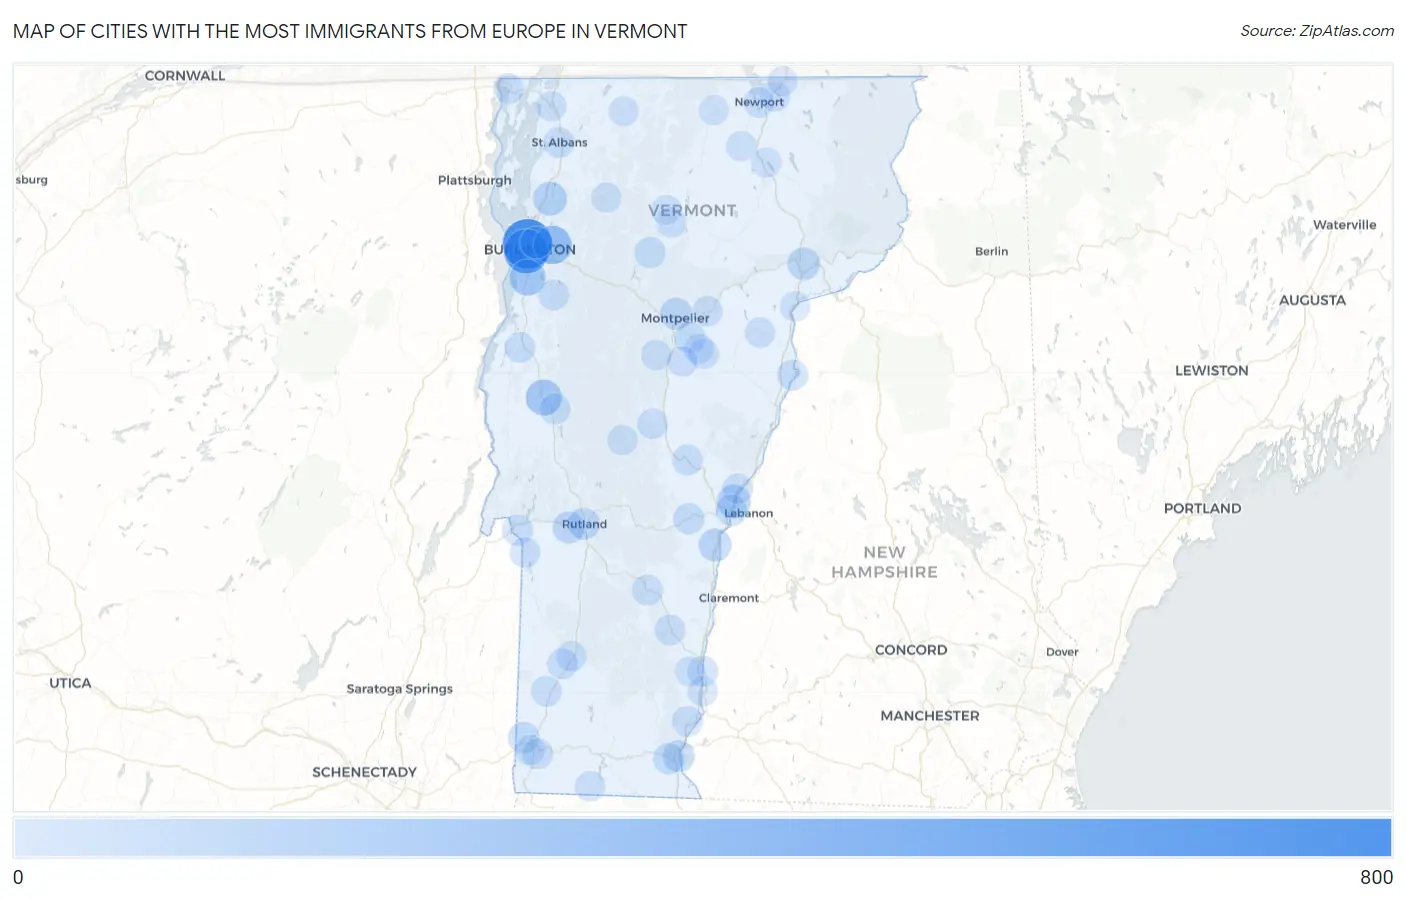
Map of Cities with the Most Immigrants from Europe in Vermont
0
800
Cities with the Most Immigrants from Europe in Vermont
| City | Europe | vs State | vs National | |
| 1. | Burlington | 682 | 8,080(8.44%)#1 | 4,820,287(0.01%)#1,017 |
| 2. | South Burlington | 494 | 8,080(6.11%)#2 | 4,820,287(0.01%)#1,391 |
| 3. | Essex Junction | 281 | 8,080(3.48%)#3 | 4,820,287(0.01%)#2,192 |
| 4. | Shelburne | 201 | 8,080(2.49%)#4 | 4,820,287(0.00%)#2,747 |
| 5. | Middlebury | 197 | 8,080(2.44%)#5 | 4,820,287(0.00%)#2,785 |
| 6. | Milton | 121 | 8,080(1.50%)#6 | 4,820,287(0.00%)#3,778 |
| 7. | Wilder | 112 | 8,080(1.39%)#7 | 4,820,287(0.00%)#3,935 |
| 8. | Hartland | 88 | 8,080(1.09%)#8 | 4,820,287(0.00%)#4,494 |
| 9. | St Johnsbury | 80 | 8,080(0.99%)#9 | 4,820,287(0.00%)#4,713 |
| 10. | Winooski | 72 | 8,080(0.89%)#10 | 4,820,287(0.00%)#4,937 |
| 11. | Montpelier | 70 | 8,080(0.87%)#11 | 4,820,287(0.00%)#5,008 |
| 12. | West Rutland | 65 | 8,080(0.80%)#12 | 4,820,287(0.00%)#5,184 |
| 13. | Rutland | 63 | 8,080(0.78%)#13 | 4,820,287(0.00%)#5,228 |
| 14. | Brattleboro | 60 | 8,080(0.74%)#14 | 4,820,287(0.00%)#5,358 |
| 15. | White River Junction | 45 | 8,080(0.56%)#15 | 4,820,287(0.00%)#6,110 |
| 16. | North Bennington | 43 | 8,080(0.53%)#16 | 4,820,287(0.00%)#6,251 |
| 17. | Woodstock | 40 | 8,080(0.50%)#17 | 4,820,287(0.00%)#6,445 |
| 18. | Barre | 39 | 8,080(0.48%)#18 | 4,820,287(0.00%)#6,470 |
| 19. | West Brattleboro | 36 | 8,080(0.45%)#19 | 4,820,287(0.00%)#6,742 |
| 20. | Stowe | 31 | 8,080(0.38%)#20 | 4,820,287(0.00%)#7,140 |
| 21. | Newbury | 29 | 8,080(0.36%)#21 | 4,820,287(0.00%)#7,318 |
| 22. | Putney | 28 | 8,080(0.35%)#22 | 4,820,287(0.00%)#7,406 |
| 23. | Fair Haven | 27 | 8,080(0.33%)#23 | 4,820,287(0.00%)#7,464 |
| 24. | Bennington | 26 | 8,080(0.32%)#24 | 4,820,287(0.00%)#7,518 |
| 25. | St Albans | 26 | 8,080(0.32%)#25 | 4,820,287(0.00%)#7,525 |
| 26. | South Royalton | 25 | 8,080(0.31%)#26 | 4,820,287(0.00%)#7,699 |
| 27. | Hinesburg | 24 | 8,080(0.30%)#27 | 4,820,287(0.00%)#7,783 |
| 28. | Ludlow | 24 | 8,080(0.30%)#28 | 4,820,287(0.00%)#7,785 |
| 29. | Chester | 23 | 8,080(0.28%)#29 | 4,820,287(0.00%)#7,893 |
| 30. | East Middlebury | 23 | 8,080(0.28%)#30 | 4,820,287(0.00%)#7,903 |
| 31. | Bellows Falls | 22 | 8,080(0.27%)#31 | 4,820,287(0.00%)#7,979 |
| 32. | Vergennes | 21 | 8,080(0.26%)#32 | 4,820,287(0.00%)#8,134 |
| 33. | Manchester | 20 | 8,080(0.25%)#33 | 4,820,287(0.00%)#8,318 |
| 34. | Arlington | 19 | 8,080(0.24%)#34 | 4,820,287(0.00%)#8,423 |
| 35. | Harmonyville | 19 | 8,080(0.24%)#35 | 4,820,287(0.00%)#8,462 |
| 36. | Danby | 19 | 8,080(0.24%)#36 | 4,820,287(0.00%)#8,463 |
| 37. | Manchester Center | 17 | 8,080(0.21%)#37 | 4,820,287(0.00%)#8,727 |
| 38. | Chimney Hill | 17 | 8,080(0.21%)#38 | 4,820,287(0.00%)#8,800 |
| 39. | Newport | 16 | 8,080(0.20%)#39 | 4,820,287(0.00%)#8,834 |
| 40. | Northfield | 16 | 8,080(0.20%)#40 | 4,820,287(0.00%)#8,835 |
| 41. | Poultney | 16 | 8,080(0.20%)#41 | 4,820,287(0.00%)#8,913 |
| 42. | Norwich | 16 | 8,080(0.20%)#42 | 4,820,287(0.00%)#8,936 |
| 43. | Killington | 16 | 8,080(0.20%)#43 | 4,820,287(0.00%)#8,948 |
| 44. | Morrisville | 15 | 8,080(0.19%)#44 | 4,820,287(0.00%)#9,043 |
| 45. | Plainfield | 15 | 8,080(0.19%)#45 | 4,820,287(0.00%)#9,146 |
| 46. | Randolph | 14 | 8,080(0.17%)#46 | 4,820,287(0.00%)#9,261 |
| 47. | Underhill Flats | 13 | 8,080(0.16%)#47 | 4,820,287(0.00%)#9,526 |
| 48. | South Lincoln | 13 | 8,080(0.16%)#48 | 4,820,287(0.00%)#9,547 |
| 49. | East Barre | 12 | 8,080(0.15%)#49 | 4,820,287(0.00%)#9,709 |
| 50. | Alburgh | 12 | 8,080(0.15%)#50 | 4,820,287(0.00%)#9,758 |
| 51. | Proctor | 10 | 8,080(0.12%)#51 | 4,820,287(0.00%)#10,160 |
| 52. | Websterville | 10 | 8,080(0.12%)#52 | 4,820,287(0.00%)#10,287 |
| 53. | Williamstown | 9 | 8,080(0.11%)#53 | 4,820,287(0.00%)#10,462 |
| 54. | Derby Center | 9 | 8,080(0.11%)#54 | 4,820,287(0.00%)#10,528 |
| 55. | North Clarendon | 9 | 8,080(0.11%)#55 | 4,820,287(0.00%)#10,573 |
| 56. | Groton | 8 | 8,080(0.10%)#56 | 4,820,287(0.00%)#10,855 |
| 57. | Pawlet | 8 | 8,080(0.10%)#57 | 4,820,287(0.00%)#10,890 |
| 58. | Rochester | 8 | 8,080(0.10%)#58 | 4,820,287(0.00%)#10,892 |
| 59. | Wardsboro | 8 | 8,080(0.10%)#59 | 4,820,287(0.00%)#10,909 |
| 60. | Swanton | 6 | 8,080(0.07%)#60 | 4,820,287(0.00%)#11,365 |
| 61. | Readsboro | 6 | 8,080(0.07%)#61 | 4,820,287(0.00%)#11,638 |
| 62. | Cambridge | 6 | 8,080(0.07%)#62 | 4,820,287(0.00%)#11,663 |
| 63. | West Dummerston | 6 | 8,080(0.07%)#63 | 4,820,287(0.00%)#11,678 |
| 64. | Saxtons River | 5 | 8,080(0.06%)#64 | 4,820,287(0.00%)#11,976 |
| 65. | Derby Line | 4 | 8,080(0.05%)#65 | 4,820,287(0.00%)#12,391 |
| 66. | Huntington | 4 | 8,080(0.05%)#66 | 4,820,287(0.00%)#12,418 |
| 67. | Old Bennington | 4 | 8,080(0.05%)#67 | 4,820,287(0.00%)#12,550 |
| 68. | Sutton | 4 | 8,080(0.05%)#68 | 4,820,287(0.00%)#12,551 |
| 69. | Troy | 4 | 8,080(0.05%)#69 | 4,820,287(0.00%)#12,555 |
| 70. | Enosburg Falls | 3 | 8,080(0.04%)#70 | 4,820,287(0.00%)#12,692 |
| 71. | Barton | 3 | 8,080(0.04%)#71 | 4,820,287(0.00%)#12,919 |
| 72. | Stamford | 3 | 8,080(0.04%)#72 | 4,820,287(0.00%)#12,974 |
| 73. | Hyde Park | 3 | 8,080(0.04%)#73 | 4,820,287(0.00%)#13,014 |
| 74. | Irasburg | 3 | 8,080(0.04%)#74 | 4,820,287(0.00%)#13,114 |
| 75. | Barnet | 3 | 8,080(0.04%)#75 | 4,820,287(0.00%)#13,134 |
| 76. | Westminster | 2 | 8,080(0.02%)#76 | 4,820,287(0.00%)#13,547 |
| 77. | Lincoln | 2 | 8,080(0.02%)#77 | 4,820,287(0.00%)#13,816 |
1
2Common Questions
What are the Top 10 Cities with the Most Immigrants from Europe in Vermont?
Top 10 Cities with the Most Immigrants from Europe in Vermont are:
#1
682
#2
494
#3
281
#4
201
#5
197
#6
121
#7
112
#8
88
#9
80
#10
72
What city has the Most Immigrants from Europe in Vermont?
Burlington has the Most Immigrants from Europe in Vermont with 682.
What is the Total Immigrants from Europe in the State of Vermont?
Total Immigrants from Europe in Vermont is 8,080.
What is the Total Immigrants from Europe in the United States?
Total Immigrants from Europe in the United States is 4,820,287.