Cities with the Most Immigrants from Europe in Missouri
RELATED REPORTS & OPTIONS
Europe
Missouri
Compare Cities
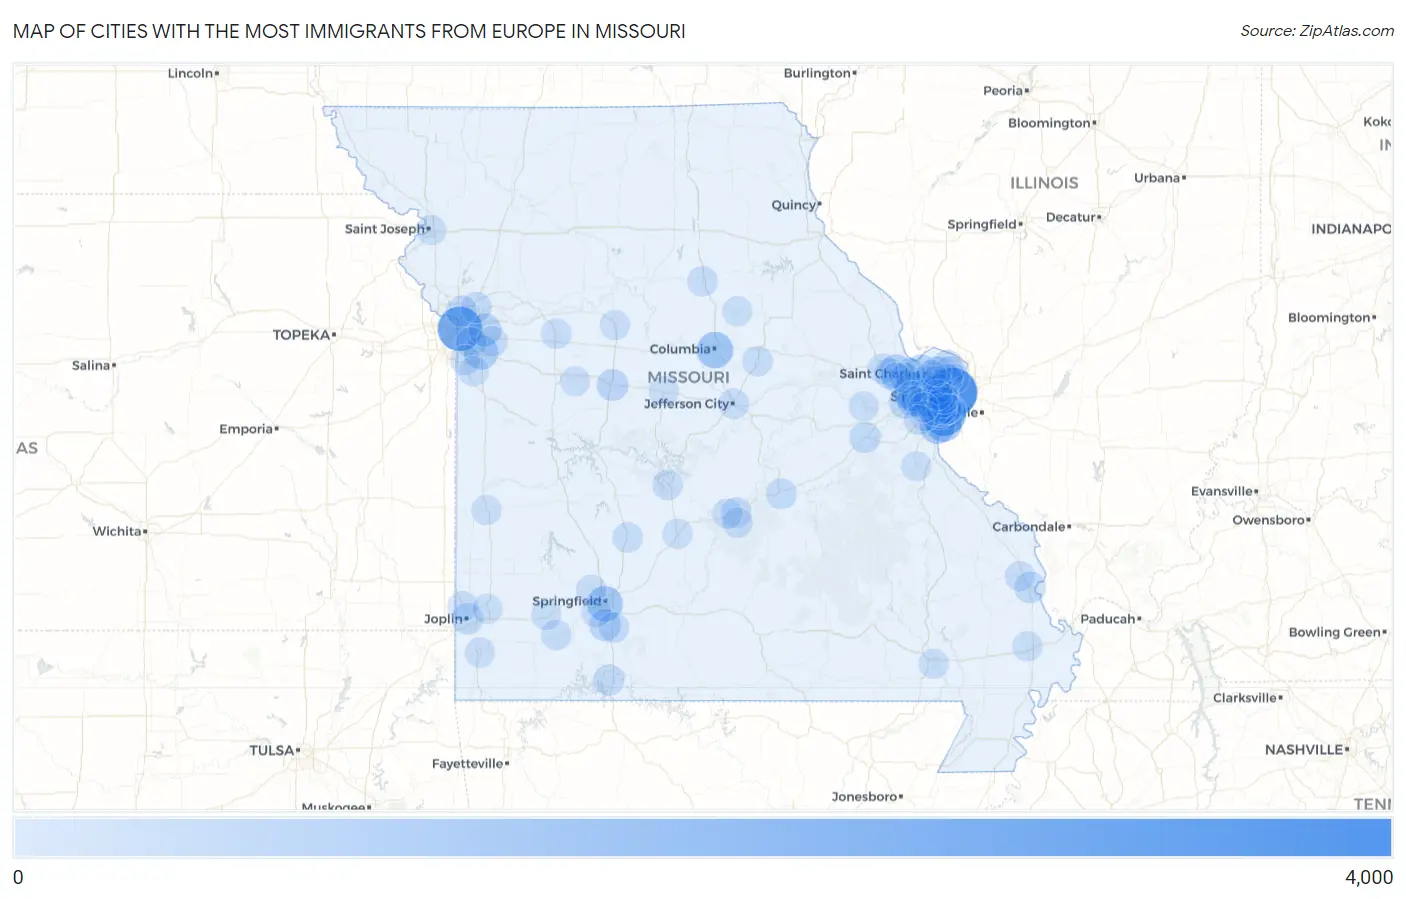
Map of Cities with the Most Immigrants from Europe in Missouri
0
4,000
Cities with the Most Immigrants from Europe in Missouri
| City | Europe | vs State | vs National | |
| 1. | St Louis | 3,505 | 45,255(7.75%)#1 | 4,820,287(0.07%)#147 |
| 2. | Kansas City | 2,592 | 45,255(5.73%)#2 | 4,820,287(0.05%)#217 |
| 3. | Mehlville | 2,537 | 45,255(5.61%)#3 | 4,820,287(0.05%)#222 |
| 4. | Chesterfield | 1,818 | 45,255(4.02%)#4 | 4,820,287(0.04%)#337 |
| 5. | Lemay | 1,170 | 45,255(2.59%)#5 | 4,820,287(0.02%)#594 |
| 6. | Affton | 1,164 | 45,255(2.57%)#6 | 4,820,287(0.02%)#599 |
| 7. | Columbia | 1,094 | 45,255(2.42%)#7 | 4,820,287(0.02%)#641 |
| 8. | Oakville | 1,074 | 45,255(2.37%)#8 | 4,820,287(0.02%)#656 |
| 9. | Springfield | 988 | 45,255(2.18%)#9 | 4,820,287(0.02%)#704 |
| 10. | Arnold | 910 | 45,255(2.01%)#10 | 4,820,287(0.02%)#756 |
| 11. | Lee S Summit | 761 | 45,255(1.68%)#11 | 4,820,287(0.02%)#892 |
| 12. | O Fallon | 677 | 45,255(1.50%)#12 | 4,820,287(0.01%)#1,031 |
| 13. | Concord | 623 | 45,255(1.38%)#13 | 4,820,287(0.01%)#1,112 |
| 14. | St Charles | 602 | 45,255(1.33%)#14 | 4,820,287(0.01%)#1,159 |
| 15. | Creve Coeur | 568 | 45,255(1.26%)#15 | 4,820,287(0.01%)#1,234 |
| 16. | Independence | 555 | 45,255(1.23%)#16 | 4,820,287(0.01%)#1,261 |
| 17. | St George | 499 | 45,255(1.10%)#17 | 4,820,287(0.01%)#1,382 |
| 18. | Kirkwood | 464 | 45,255(1.03%)#18 | 4,820,287(0.01%)#1,463 |
| 19. | Webster Groves | 440 | 45,255(0.97%)#19 | 4,820,287(0.01%)#1,525 |
| 20. | Wildwood | 429 | 45,255(0.95%)#20 | 4,820,287(0.01%)#1,560 |
| 21. | University City | 404 | 45,255(0.89%)#21 | 4,820,287(0.01%)#1,671 |
| 22. | Maryland Heights | 404 | 45,255(0.89%)#22 | 4,820,287(0.01%)#1,672 |
| 23. | Nixa | 372 | 45,255(0.82%)#23 | 4,820,287(0.01%)#1,779 |
| 24. | Clayton | 355 | 45,255(0.78%)#24 | 4,820,287(0.01%)#1,835 |
| 25. | Sedalia | 354 | 45,255(0.78%)#25 | 4,820,287(0.01%)#1,841 |
| 26. | St Peters | 340 | 45,255(0.75%)#26 | 4,820,287(0.01%)#1,901 |
| 27. | Cape Girardeau | 297 | 45,255(0.66%)#27 | 4,820,287(0.01%)#2,116 |
| 28. | Joplin | 290 | 45,255(0.64%)#28 | 4,820,287(0.01%)#2,152 |
| 29. | Ballwin | 285 | 45,255(0.63%)#29 | 4,820,287(0.01%)#2,172 |
| 30. | Overland | 270 | 45,255(0.60%)#30 | 4,820,287(0.01%)#2,240 |
| 31. | Lake St Louis | 261 | 45,255(0.58%)#31 | 4,820,287(0.01%)#2,293 |
| 32. | St Clair | 260 | 45,255(0.57%)#32 | 4,820,287(0.01%)#2,305 |
| 33. | Sappington | 233 | 45,255(0.51%)#33 | 4,820,287(0.00%)#2,504 |
| 34. | Liberty | 227 | 45,255(0.50%)#34 | 4,820,287(0.00%)#2,550 |
| 35. | Branson | 224 | 45,255(0.49%)#35 | 4,820,287(0.00%)#2,578 |
| 36. | Green Park | 181 | 45,255(0.40%)#36 | 4,820,287(0.00%)#2,929 |
| 37. | Manchester | 179 | 45,255(0.40%)#37 | 4,820,287(0.00%)#2,948 |
| 38. | Rolla | 178 | 45,255(0.39%)#38 | 4,820,287(0.00%)#2,965 |
| 39. | Crestwood | 169 | 45,255(0.37%)#39 | 4,820,287(0.00%)#3,065 |
| 40. | Gladstone | 165 | 45,255(0.36%)#40 | 4,820,287(0.00%)#3,118 |
| 41. | Brentwood | 164 | 45,255(0.36%)#41 | 4,820,287(0.00%)#3,136 |
| 42. | Ozark | 157 | 45,255(0.35%)#42 | 4,820,287(0.00%)#3,235 |
| 43. | Town And Country | 150 | 45,255(0.33%)#43 | 4,820,287(0.00%)#3,321 |
| 44. | Des Peres | 140 | 45,255(0.31%)#44 | 4,820,287(0.00%)#3,461 |
| 45. | Raytown | 139 | 45,255(0.31%)#45 | 4,820,287(0.00%)#3,472 |
| 46. | Richmond Heights | 137 | 45,255(0.30%)#46 | 4,820,287(0.00%)#3,503 |
| 47. | St Robert | 131 | 45,255(0.29%)#47 | 4,820,287(0.00%)#3,595 |
| 48. | Ellisville | 130 | 45,255(0.29%)#48 | 4,820,287(0.00%)#3,603 |
| 49. | Florissant | 127 | 45,255(0.28%)#49 | 4,820,287(0.00%)#3,658 |
| 50. | Blue Springs | 125 | 45,255(0.28%)#50 | 4,820,287(0.00%)#3,691 |
| 51. | Jefferson City | 125 | 45,255(0.28%)#51 | 4,820,287(0.00%)#3,692 |
| 52. | Buffalo | 117 | 45,255(0.26%)#52 | 4,820,287(0.00%)#3,848 |
| 53. | Cottleville | 112 | 45,255(0.25%)#53 | 4,820,287(0.00%)#3,932 |
| 54. | Camdenton | 112 | 45,255(0.25%)#54 | 4,820,287(0.00%)#3,934 |
| 55. | Fort Leonard Wood | 110 | 45,255(0.24%)#55 | 4,820,287(0.00%)#3,962 |
| 56. | Willard | 109 | 45,255(0.24%)#56 | 4,820,287(0.00%)#3,979 |
| 57. | Higginsville | 107 | 45,255(0.24%)#57 | 4,820,287(0.00%)#4,025 |
| 58. | Sunset Hills | 104 | 45,255(0.23%)#58 | 4,820,287(0.00%)#4,088 |
| 59. | Carl Junction | 103 | 45,255(0.23%)#59 | 4,820,287(0.00%)#4,121 |
| 60. | Bella Villa | 101 | 45,255(0.22%)#60 | 4,820,287(0.00%)#4,173 |
| 61. | Grandview | 98 | 45,255(0.22%)#61 | 4,820,287(0.00%)#4,222 |
| 62. | Fulton | 96 | 45,255(0.21%)#62 | 4,820,287(0.00%)#4,281 |
| 63. | Old Jamestown | 94 | 45,255(0.21%)#63 | 4,820,287(0.00%)#4,316 |
| 64. | Moberly | 94 | 45,255(0.21%)#64 | 4,820,287(0.00%)#4,319 |
| 65. | Aurora | 92 | 45,255(0.20%)#65 | 4,820,287(0.00%)#4,374 |
| 66. | Shrewsbury | 86 | 45,255(0.19%)#66 | 4,820,287(0.00%)#4,549 |
| 67. | Lebanon | 85 | 45,255(0.19%)#67 | 4,820,287(0.00%)#4,566 |
| 68. | Bellefontaine Neighbors | 85 | 45,255(0.19%)#68 | 4,820,287(0.00%)#4,570 |
| 69. | Wentzville | 84 | 45,255(0.19%)#69 | 4,820,287(0.00%)#4,585 |
| 70. | Olivette | 84 | 45,255(0.19%)#70 | 4,820,287(0.00%)#4,598 |
| 71. | Black Jack | 84 | 45,255(0.19%)#71 | 4,820,287(0.00%)#4,602 |
| 72. | Jackson | 82 | 45,255(0.18%)#72 | 4,820,287(0.00%)#4,645 |
| 73. | Marshall | 78 | 45,255(0.17%)#73 | 4,820,287(0.00%)#4,768 |
| 74. | Waynesville | 78 | 45,255(0.17%)#74 | 4,820,287(0.00%)#4,775 |
| 75. | Raymore | 75 | 45,255(0.17%)#75 | 4,820,287(0.00%)#4,845 |
| 76. | St Ann | 75 | 45,255(0.17%)#76 | 4,820,287(0.00%)#4,856 |
| 77. | Lakeshire | 71 | 45,255(0.16%)#77 | 4,820,287(0.00%)#4,995 |
| 78. | Sikeston | 70 | 45,255(0.15%)#78 | 4,820,287(0.00%)#5,001 |
| 79. | Clarkson Valley | 70 | 45,255(0.15%)#79 | 4,820,287(0.00%)#5,021 |
| 80. | Carthage | 69 | 45,255(0.15%)#80 | 4,820,287(0.00%)#5,032 |
| 81. | St Joseph | 66 | 45,255(0.15%)#81 | 4,820,287(0.00%)#5,130 |
| 82. | Neosho | 66 | 45,255(0.15%)#82 | 4,820,287(0.00%)#5,137 |
| 83. | Ferguson | 65 | 45,255(0.14%)#83 | 4,820,287(0.00%)#5,161 |
| 84. | Battlefield | 65 | 45,255(0.14%)#84 | 4,820,287(0.00%)#5,174 |
| 85. | Dardenne Prairie | 63 | 45,255(0.14%)#85 | 4,820,287(0.00%)#5,230 |
| 86. | Tipton | 62 | 45,255(0.14%)#86 | 4,820,287(0.00%)#5,293 |
| 87. | Ladue | 60 | 45,255(0.13%)#87 | 4,820,287(0.00%)#5,356 |
| 88. | Murphy | 58 | 45,255(0.13%)#88 | 4,820,287(0.00%)#5,438 |
| 89. | Bridgeton | 53 | 45,255(0.12%)#89 | 4,820,287(0.00%)#5,662 |
| 90. | De Soto | 52 | 45,255(0.11%)#90 | 4,820,287(0.00%)#5,721 |
| 91. | Mount Vernon | 52 | 45,255(0.11%)#91 | 4,820,287(0.00%)#5,730 |
| 92. | Whiteman Afb | 52 | 45,255(0.11%)#92 | 4,820,287(0.00%)#5,735 |
| 93. | Maplewood | 51 | 45,255(0.11%)#93 | 4,820,287(0.00%)#5,772 |
| 94. | Hazelwood | 48 | 45,255(0.11%)#94 | 4,820,287(0.00%)#5,909 |
| 95. | Poplar Bluff | 48 | 45,255(0.11%)#95 | 4,820,287(0.00%)#5,915 |
| 96. | High Ridge | 47 | 45,255(0.10%)#96 | 4,820,287(0.00%)#5,995 |
| 97. | Nevada | 46 | 45,255(0.10%)#97 | 4,820,287(0.00%)#6,029 |
| 98. | Valley Park | 46 | 45,255(0.10%)#98 | 4,820,287(0.00%)#6,034 |
| 99. | Centralia | 46 | 45,255(0.10%)#99 | 4,820,287(0.00%)#6,042 |
| 100. | Washington | 45 | 45,255(0.10%)#100 | 4,820,287(0.00%)#6,080 |
Common Questions
What are the Top 10 Cities with the Most Immigrants from Europe in Missouri?
Top 10 Cities with the Most Immigrants from Europe in Missouri are:
#1
3,505
#2
2,592
#3
2,537
#4
1,818
#5
1,170
#6
1,164
#7
1,094
#8
1,074
#9
988
#10
910
What city has the Most Immigrants from Europe in Missouri?
St Louis has the Most Immigrants from Europe in Missouri with 3,505.
What is the Total Immigrants from Europe in the State of Missouri?
Total Immigrants from Europe in Missouri is 45,255.
What is the Total Immigrants from Europe in the United States?
Total Immigrants from Europe in the United States is 4,820,287.