Cities with the Most Immigrants from Europe in Pennsylvania
RELATED REPORTS & OPTIONS
Europe
Pennsylvania
Compare Cities
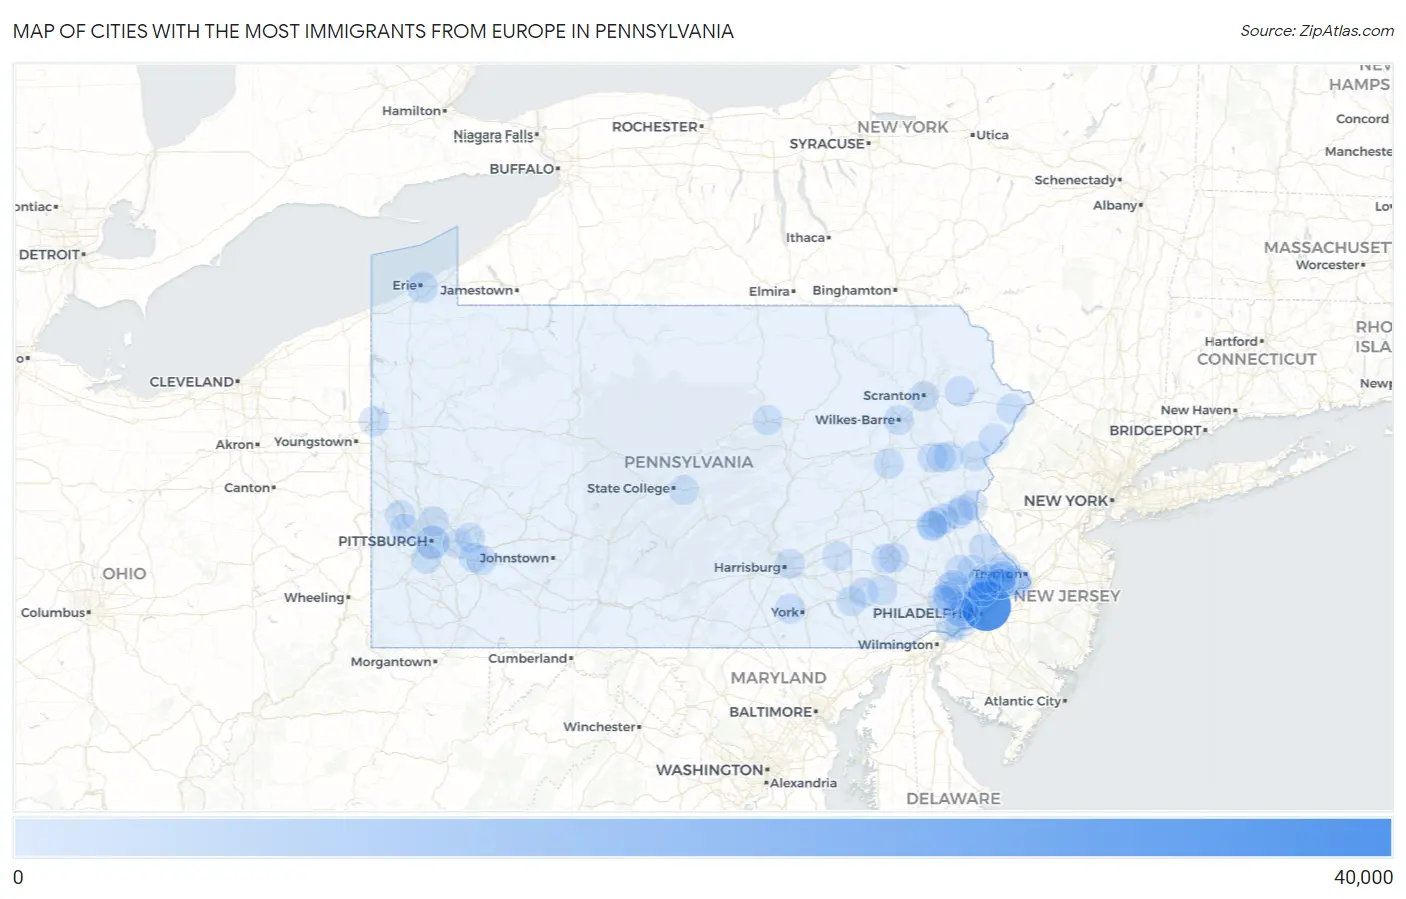
Map of Cities with the Most Immigrants from Europe in Pennsylvania
0
40,000
Cities with the Most Immigrants from Europe in Pennsylvania
| City | Europe | vs State | vs National | |
| 1. | Philadelphia | 33,811 | 168,145(20.11%)#1 | 4,820,287(0.70%)#5 |
| 2. | Pittsburgh | 5,682 | 168,145(3.38%)#2 | 4,820,287(0.12%)#65 |
| 3. | Erie | 1,524 | 168,145(0.91%)#3 | 4,820,287(0.03%)#428 |
| 4. | Bethlehem | 1,310 | 168,145(0.78%)#4 | 4,820,287(0.03%)#530 |
| 5. | State College Borough | 1,114 | 168,145(0.66%)#5 | 4,820,287(0.02%)#628 |
| 6. | Allentown | 996 | 168,145(0.59%)#6 | 4,820,287(0.02%)#698 |
| 7. | Levittown | 878 | 168,145(0.52%)#7 | 4,820,287(0.02%)#783 |
| 8. | Scranton | 687 | 168,145(0.41%)#8 | 4,820,287(0.01%)#1,005 |
| 9. | Churchville | 664 | 168,145(0.39%)#9 | 4,820,287(0.01%)#1,047 |
| 10. | King Of Prussia | 623 | 168,145(0.37%)#10 | 4,820,287(0.01%)#1,111 |
| 11. | Carlisle Borough | 562 | 168,145(0.33%)#11 | 4,820,287(0.01%)#1,247 |
| 12. | Drexel Hill | 561 | 168,145(0.33%)#12 | 4,820,287(0.01%)#1,250 |
| 13. | Ephrata Borough | 529 | 168,145(0.31%)#13 | 4,820,287(0.01%)#1,311 |
| 14. | Morrisville Borough | 491 | 168,145(0.29%)#14 | 4,820,287(0.01%)#1,400 |
| 15. | Bethel Park | 478 | 168,145(0.28%)#15 | 4,820,287(0.01%)#1,430 |
| 16. | Lansdale Borough | 469 | 168,145(0.28%)#16 | 4,820,287(0.01%)#1,458 |
| 17. | Hazleton | 455 | 168,145(0.27%)#17 | 4,820,287(0.01%)#1,486 |
| 18. | Wilkes Barre | 441 | 168,145(0.26%)#18 | 4,820,287(0.01%)#1,522 |
| 19. | Doylestown Borough | 431 | 168,145(0.26%)#19 | 4,820,287(0.01%)#1,553 |
| 20. | Allison Park | 424 | 168,145(0.25%)#20 | 4,820,287(0.01%)#1,578 |
| 21. | Wayne | 413 | 168,145(0.25%)#21 | 4,820,287(0.01%)#1,626 |
| 22. | Bala Cynwyd | 394 | 168,145(0.23%)#22 | 4,820,287(0.01%)#1,708 |
| 23. | Richboro | 383 | 168,145(0.23%)#23 | 4,820,287(0.01%)#1,742 |
| 24. | Reading | 381 | 168,145(0.23%)#24 | 4,820,287(0.01%)#1,747 |
| 25. | East Stroudsburg Borough | 355 | 168,145(0.21%)#25 | 4,820,287(0.01%)#1,838 |
| 26. | Baldwin Borough | 350 | 168,145(0.21%)#26 | 4,820,287(0.01%)#1,852 |
| 27. | Montgomeryville | 350 | 168,145(0.21%)#27 | 4,820,287(0.01%)#1,858 |
| 28. | Newtown Grant | 333 | 168,145(0.20%)#28 | 4,820,287(0.01%)#1,935 |
| 29. | Trexlertown | 330 | 168,145(0.20%)#29 | 4,820,287(0.01%)#1,952 |
| 30. | Woodlyn | 321 | 168,145(0.19%)#30 | 4,820,287(0.01%)#2,003 |
| 31. | Weigelstown | 312 | 168,145(0.19%)#31 | 4,820,287(0.01%)#2,044 |
| 32. | Ardmore | 307 | 168,145(0.18%)#32 | 4,820,287(0.01%)#2,069 |
| 33. | Trevose | 305 | 168,145(0.18%)#33 | 4,820,287(0.01%)#2,088 |
| 34. | The Hideout | 300 | 168,145(0.18%)#34 | 4,820,287(0.01%)#2,104 |
| 35. | Easton | 295 | 168,145(0.18%)#35 | 4,820,287(0.01%)#2,127 |
| 36. | Wyomissing Borough | 284 | 168,145(0.17%)#36 | 4,820,287(0.01%)#2,177 |
| 37. | Audubon | 283 | 168,145(0.17%)#37 | 4,820,287(0.01%)#2,182 |
| 38. | Broomall | 261 | 168,145(0.16%)#38 | 4,820,287(0.01%)#2,295 |
| 39. | Aliquippa | 257 | 168,145(0.15%)#39 | 4,820,287(0.01%)#2,329 |
| 40. | Monroeville | 256 | 168,145(0.15%)#40 | 4,820,287(0.01%)#2,332 |
| 41. | Trappe Borough | 249 | 168,145(0.15%)#41 | 4,820,287(0.01%)#2,382 |
| 42. | Fort Washington | 243 | 168,145(0.14%)#42 | 4,820,287(0.01%)#2,420 |
| 43. | Narberth Borough | 243 | 168,145(0.14%)#43 | 4,820,287(0.01%)#2,421 |
| 44. | Kulpsville | 238 | 168,145(0.14%)#44 | 4,820,287(0.00%)#2,457 |
| 45. | Elizabethtown Borough | 237 | 168,145(0.14%)#45 | 4,820,287(0.00%)#2,466 |
| 46. | Phoenixville Borough | 235 | 168,145(0.14%)#46 | 4,820,287(0.00%)#2,481 |
| 47. | Horsham | 231 | 168,145(0.14%)#47 | 4,820,287(0.00%)#2,522 |
| 48. | Plumsteadville | 227 | 168,145(0.14%)#48 | 4,820,287(0.00%)#2,557 |
| 49. | East Earl | 224 | 168,145(0.13%)#49 | 4,820,287(0.00%)#2,581 |
| 50. | Willow Grove | 219 | 168,145(0.13%)#50 | 4,820,287(0.00%)#2,610 |
| 51. | Economy Borough | 214 | 168,145(0.13%)#51 | 4,820,287(0.00%)#2,639 |
| 52. | Conshohocken Borough | 212 | 168,145(0.13%)#52 | 4,820,287(0.00%)#2,652 |
| 53. | Norristown Borough | 209 | 168,145(0.12%)#53 | 4,820,287(0.00%)#2,669 |
| 54. | Emmaus Borough | 209 | 168,145(0.12%)#54 | 4,820,287(0.00%)#2,676 |
| 55. | Towamensing Trails | 207 | 168,145(0.12%)#55 | 4,820,287(0.00%)#2,695 |
| 56. | Warminster Heights | 205 | 168,145(0.12%)#56 | 4,820,287(0.00%)#2,711 |
| 57. | Village Green Green Ridge | 203 | 168,145(0.12%)#57 | 4,820,287(0.00%)#2,727 |
| 58. | Arlington Heights | 203 | 168,145(0.12%)#58 | 4,820,287(0.00%)#2,729 |
| 59. | Sharon | 200 | 168,145(0.12%)#59 | 4,820,287(0.00%)#2,756 |
| 60. | Wescosville | 198 | 168,145(0.12%)#60 | 4,820,287(0.00%)#2,774 |
| 61. | Honesdale Borough | 198 | 168,145(0.12%)#61 | 4,820,287(0.00%)#2,775 |
| 62. | West Wyomissing | 197 | 168,145(0.12%)#62 | 4,820,287(0.00%)#2,786 |
| 63. | Mont Clare | 197 | 168,145(0.12%)#63 | 4,820,287(0.00%)#2,787 |
| 64. | Lancaster | 194 | 168,145(0.12%)#64 | 4,820,287(0.00%)#2,804 |
| 65. | Leola | 193 | 168,145(0.11%)#65 | 4,820,287(0.00%)#2,814 |
| 66. | Feasterville | 192 | 168,145(0.11%)#66 | 4,820,287(0.00%)#2,821 |
| 67. | Murrysville | 191 | 168,145(0.11%)#67 | 4,820,287(0.00%)#2,823 |
| 68. | Jeannette | 191 | 168,145(0.11%)#68 | 4,820,287(0.00%)#2,826 |
| 69. | Wind Gap Borough | 190 | 168,145(0.11%)#69 | 4,820,287(0.00%)#2,843 |
| 70. | Lebanon | 184 | 168,145(0.11%)#70 | 4,820,287(0.00%)#2,891 |
| 71. | Fairless Hills | 184 | 168,145(0.11%)#71 | 4,820,287(0.00%)#2,897 |
| 72. | Pocono Woodland Lakes | 184 | 168,145(0.11%)#72 | 4,820,287(0.00%)#2,902 |
| 73. | Berwyn | 182 | 168,145(0.11%)#73 | 4,820,287(0.00%)#2,918 |
| 74. | Ancient Oaks | 181 | 168,145(0.11%)#74 | 4,820,287(0.00%)#2,927 |
| 75. | Kingston Borough | 179 | 168,145(0.11%)#75 | 4,820,287(0.00%)#2,952 |
| 76. | Brookhaven Borough | 179 | 168,145(0.11%)#76 | 4,820,287(0.00%)#2,956 |
| 77. | Glenside | 178 | 168,145(0.11%)#77 | 4,820,287(0.00%)#2,971 |
| 78. | Pottstown Borough | 176 | 168,145(0.10%)#78 | 4,820,287(0.00%)#2,991 |
| 79. | Trooper | 175 | 168,145(0.10%)#79 | 4,820,287(0.00%)#3,010 |
| 80. | Media Borough | 173 | 168,145(0.10%)#80 | 4,820,287(0.00%)#3,024 |
| 81. | Middletown | 168 | 168,145(0.10%)#81 | 4,820,287(0.00%)#3,080 |
| 82. | Village Shires | 168 | 168,145(0.10%)#82 | 4,820,287(0.00%)#3,087 |
| 83. | Mount Pocono Borough | 168 | 168,145(0.10%)#83 | 4,820,287(0.00%)#3,088 |
| 84. | Paoli | 167 | 168,145(0.10%)#84 | 4,820,287(0.00%)#3,099 |
| 85. | Mckinley | 165 | 168,145(0.10%)#85 | 4,820,287(0.00%)#3,130 |
| 86. | Carnot Moon | 163 | 168,145(0.10%)#86 | 4,820,287(0.00%)#3,149 |
| 87. | Chesterbrook | 163 | 168,145(0.10%)#87 | 4,820,287(0.00%)#3,153 |
| 88. | Sierra View | 161 | 168,145(0.10%)#88 | 4,820,287(0.00%)#3,180 |
| 89. | Indian Mountain Lake | 160 | 168,145(0.10%)#89 | 4,820,287(0.00%)#3,199 |
| 90. | Saw Creek | 160 | 168,145(0.10%)#90 | 4,820,287(0.00%)#3,200 |
| 91. | St. Davids | 160 | 168,145(0.10%)#91 | 4,820,287(0.00%)#3,201 |
| 92. | Chambersburg Borough | 159 | 168,145(0.09%)#92 | 4,820,287(0.00%)#3,204 |
| 93. | Elkins Park | 159 | 168,145(0.09%)#93 | 4,820,287(0.00%)#3,214 |
| 94. | Greensburg | 158 | 168,145(0.09%)#94 | 4,820,287(0.00%)#3,222 |
| 95. | Boalsburg | 158 | 168,145(0.09%)#95 | 4,820,287(0.00%)#3,231 |
| 96. | Williamsport | 155 | 168,145(0.09%)#96 | 4,820,287(0.00%)#3,252 |
| 97. | Progress | 155 | 168,145(0.09%)#97 | 4,820,287(0.00%)#3,261 |
| 98. | Roslyn | 154 | 168,145(0.09%)#98 | 4,820,287(0.00%)#3,273 |
| 99. | Swarthmore Borough | 154 | 168,145(0.09%)#99 | 4,820,287(0.00%)#3,274 |
| 100. | Norwood Borough | 154 | 168,145(0.09%)#100 | 4,820,287(0.00%)#3,275 |
Common Questions
What are the Top 10 Cities with the Most Immigrants from Europe in Pennsylvania?
Top 10 Cities with the Most Immigrants from Europe in Pennsylvania are:
#1
33,811
#2
5,682
#3
1,524
#4
1,310
#5
996
#6
878
#7
687
#8
664
#9
623
#10
561
What city has the Most Immigrants from Europe in Pennsylvania?
Philadelphia has the Most Immigrants from Europe in Pennsylvania with 33,811.
What is the Total Immigrants from Europe in the State of Pennsylvania?
Total Immigrants from Europe in Pennsylvania is 168,145.
What is the Total Immigrants from Europe in the United States?
Total Immigrants from Europe in the United States is 4,820,287.