Cities with the Most Immigrants from Europe in New Mexico
RELATED REPORTS & OPTIONS
Europe
New Mexico
Compare Cities
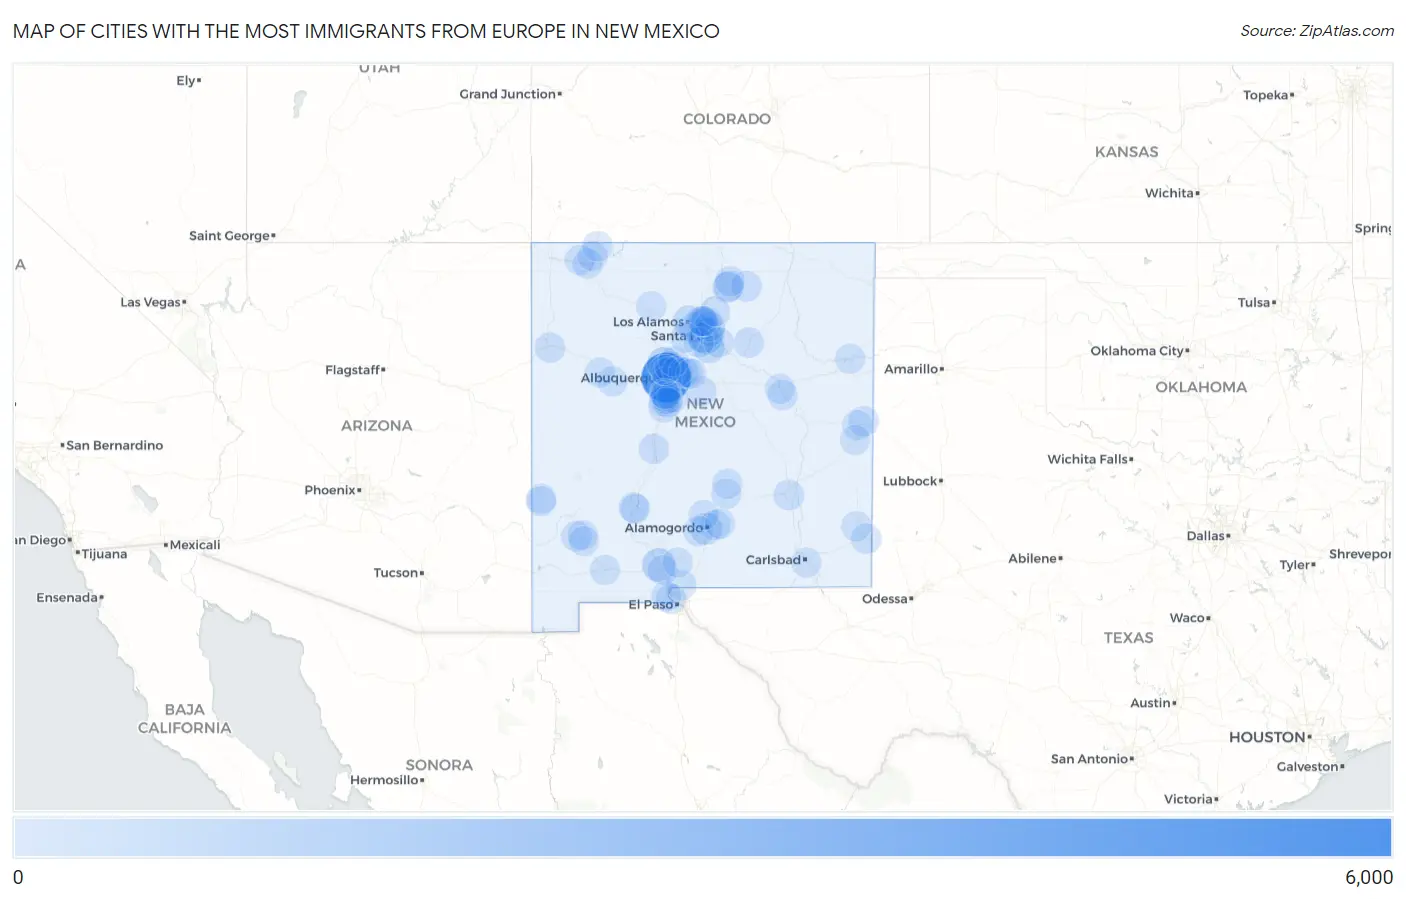
Map of Cities with the Most Immigrants from Europe in New Mexico
0
6,000
Cities with the Most Immigrants from Europe in New Mexico
| City | Europe | vs State | vs National | |
| 1. | Albuquerque | 5,271 | 14,573(36.17%)#1 | 4,820,287(0.11%)#75 |
| 2. | Santa Fe | 1,434 | 14,573(9.84%)#2 | 4,820,287(0.03%)#474 |
| 3. | Las Cruces | 831 | 14,573(5.70%)#3 | 4,820,287(0.02%)#815 |
| 4. | Rio Rancho | 826 | 14,573(5.67%)#4 | 4,820,287(0.02%)#820 |
| 5. | Alamogordo | 439 | 14,573(3.01%)#5 | 4,820,287(0.01%)#1,530 |
| 6. | Los Alamos | 366 | 14,573(2.51%)#6 | 4,820,287(0.01%)#1,804 |
| 7. | Eldorado At Santa Fe | 323 | 14,573(2.22%)#7 | 4,820,287(0.01%)#1,992 |
| 8. | Ranchos De Taos | 171 | 14,573(1.17%)#8 | 4,820,287(0.00%)#3,050 |
| 9. | South Valley | 140 | 14,573(0.96%)#9 | 4,820,287(0.00%)#3,456 |
| 10. | Angel Fire | 123 | 14,573(0.84%)#10 | 4,820,287(0.00%)#3,740 |
| 11. | White Rock | 119 | 14,573(0.82%)#11 | 4,820,287(0.00%)#3,819 |
| 12. | Farmington | 117 | 14,573(0.80%)#12 | 4,820,287(0.00%)#3,838 |
| 13. | North Valley | 108 | 14,573(0.74%)#13 | 4,820,287(0.00%)#3,994 |
| 14. | Taos | 101 | 14,573(0.69%)#14 | 4,820,287(0.00%)#4,164 |
| 15. | Los Ranchos De Albuquerque | 88 | 14,573(0.60%)#15 | 4,820,287(0.00%)#4,483 |
| 16. | Roswell | 86 | 14,573(0.59%)#16 | 4,820,287(0.00%)#4,534 |
| 17. | Silver City | 82 | 14,573(0.56%)#17 | 4,820,287(0.00%)#4,651 |
| 18. | Socorro | 80 | 14,573(0.55%)#18 | 4,820,287(0.00%)#4,705 |
| 19. | Rio Communities | 78 | 14,573(0.54%)#19 | 4,820,287(0.00%)#4,778 |
| 20. | Corrales | 73 | 14,573(0.50%)#20 | 4,820,287(0.00%)#4,910 |
| 21. | Hobbs | 72 | 14,573(0.49%)#21 | 4,820,287(0.00%)#4,924 |
| 22. | Gallup | 68 | 14,573(0.47%)#22 | 4,820,287(0.00%)#5,064 |
| 23. | Mcintosh | 63 | 14,573(0.43%)#23 | 4,820,287(0.00%)#5,262 |
| 24. | Clovis | 62 | 14,573(0.43%)#24 | 4,820,287(0.00%)#5,264 |
| 25. | Skyline Ganipa | 62 | 14,573(0.43%)#25 | 4,820,287(0.00%)#5,298 |
| 26. | Las Campanas | 61 | 14,573(0.42%)#26 | 4,820,287(0.00%)#5,340 |
| 27. | Tres Arroyos | 60 | 14,573(0.41%)#27 | 4,820,287(0.00%)#5,379 |
| 28. | Chaparral | 58 | 14,573(0.40%)#28 | 4,820,287(0.00%)#5,432 |
| 29. | Cuyamungue Grant | 58 | 14,573(0.40%)#29 | 4,820,287(0.00%)#5,466 |
| 30. | Las Vegas | 52 | 14,573(0.36%)#30 | 4,820,287(0.00%)#5,710 |
| 31. | Ruidoso | 47 | 14,573(0.32%)#31 | 4,820,287(0.00%)#5,979 |
| 32. | Sunland Park | 45 | 14,573(0.31%)#32 | 4,820,287(0.00%)#6,078 |
| 33. | Carlsbad | 43 | 14,573(0.30%)#33 | 4,820,287(0.00%)#6,208 |
| 34. | Santa Teresa | 41 | 14,573(0.28%)#34 | 4,820,287(0.00%)#6,342 |
| 35. | El Cerro | 38 | 14,573(0.26%)#35 | 4,820,287(0.00%)#6,569 |
| 36. | Sandia Heights | 38 | 14,573(0.26%)#36 | 4,820,287(0.00%)#6,570 |
| 37. | Barton | 38 | 14,573(0.26%)#37 | 4,820,287(0.00%)#6,584 |
| 38. | Sandia Knolls | 38 | 14,573(0.26%)#38 | 4,820,287(0.00%)#6,586 |
| 39. | Placitas Cdp Sandoval County | 37 | 14,573(0.25%)#39 | 4,820,287(0.00%)#6,636 |
| 40. | Deming | 36 | 14,573(0.25%)#40 | 4,820,287(0.00%)#6,694 |
| 41. | Bernalillo | 33 | 14,573(0.23%)#41 | 4,820,287(0.00%)#6,933 |
| 42. | Agua Fria | 33 | 14,573(0.23%)#42 | 4,820,287(0.00%)#6,961 |
| 43. | Tome | 33 | 14,573(0.23%)#43 | 4,820,287(0.00%)#6,990 |
| 44. | Lee Acres | 32 | 14,573(0.22%)#44 | 4,820,287(0.00%)#7,022 |
| 45. | El Cerro Mission | 31 | 14,573(0.21%)#45 | 4,820,287(0.00%)#7,102 |
| 46. | High Rolls | 29 | 14,573(0.20%)#46 | 4,820,287(0.00%)#7,296 |
| 47. | Holloman Afb | 28 | 14,573(0.19%)#47 | 4,820,287(0.00%)#7,358 |
| 48. | Cannon Afb | 28 | 14,573(0.19%)#48 | 4,820,287(0.00%)#7,375 |
| 49. | Espanola | 25 | 14,573(0.17%)#49 | 4,820,287(0.00%)#7,605 |
| 50. | Sandia Park | 25 | 14,573(0.17%)#50 | 4,820,287(0.00%)#7,700 |
| 51. | University Park | 23 | 14,573(0.16%)#51 | 4,820,287(0.00%)#7,853 |
| 52. | Picacho Hills | 23 | 14,573(0.16%)#52 | 4,820,287(0.00%)#7,872 |
| 53. | Rio Rancho Estates | 22 | 14,573(0.15%)#53 | 4,820,287(0.00%)#8,017 |
| 54. | Taos Pueblo | 22 | 14,573(0.15%)#54 | 4,820,287(0.00%)#8,019 |
| 55. | Santa Fe Foothills | 22 | 14,573(0.15%)#55 | 4,820,287(0.00%)#8,039 |
| 56. | White Sands | 21 | 14,573(0.14%)#56 | 4,820,287(0.00%)#8,164 |
| 57. | Cañoncito | 21 | 14,573(0.14%)#57 | 4,820,287(0.00%)#8,173 |
| 58. | Peralta | 20 | 14,573(0.14%)#58 | 4,820,287(0.00%)#8,251 |
| 59. | Capitan | 20 | 14,573(0.14%)#59 | 4,820,287(0.00%)#8,298 |
| 60. | Nambe | 19 | 14,573(0.13%)#60 | 4,820,287(0.00%)#8,415 |
| 61. | Tesuque | 19 | 14,573(0.13%)#61 | 4,820,287(0.00%)#8,443 |
| 62. | Aztec | 18 | 14,573(0.12%)#62 | 4,820,287(0.00%)#8,495 |
| 63. | Tano Road | 18 | 14,573(0.12%)#63 | 4,820,287(0.00%)#8,588 |
| 64. | Paa-Ko | 18 | 14,573(0.12%)#64 | 4,820,287(0.00%)#8,619 |
| 65. | Puerto De Luna | 18 | 14,573(0.12%)#65 | 4,820,287(0.00%)#8,625 |
| 66. | La Jara | 17 | 14,573(0.12%)#66 | 4,820,287(0.00%)#8,792 |
| 67. | Sunlit Hills | 16 | 14,573(0.11%)#67 | 4,820,287(0.00%)#8,939 |
| 68. | Valencia | 15 | 14,573(0.10%)#68 | 4,820,287(0.00%)#9,079 |
| 69. | Hyde Park | 15 | 14,573(0.10%)#69 | 4,820,287(0.00%)#9,148 |
| 70. | Lovington | 14 | 14,573(0.10%)#70 | 4,820,287(0.00%)#9,170 |
| 71. | Glenwood | 14 | 14,573(0.10%)#71 | 4,820,287(0.00%)#9,350 |
| 72. | Center Point | 13 | 14,573(0.09%)#72 | 4,820,287(0.00%)#9,424 |
| 73. | South River | 13 | 14,573(0.09%)#73 | 4,820,287(0.00%)#9,479 |
| 74. | Chupadero | 13 | 14,573(0.09%)#74 | 4,820,287(0.00%)#9,538 |
| 75. | Meadow Lake | 12 | 14,573(0.08%)#75 | 4,820,287(0.00%)#9,584 |
| 76. | La Cienega | 12 | 14,573(0.08%)#76 | 4,820,287(0.00%)#9,599 |
| 77. | Santa Clara | 12 | 14,573(0.08%)#77 | 4,820,287(0.00%)#9,665 |
| 78. | Portales | 11 | 14,573(0.08%)#78 | 4,820,287(0.00%)#9,787 |
| 79. | Truth Or Consequences | 11 | 14,573(0.08%)#79 | 4,820,287(0.00%)#9,814 |
| 80. | Las Maravillas | 11 | 14,573(0.08%)#80 | 4,820,287(0.00%)#9,912 |
| 81. | Hurley | 11 | 14,573(0.08%)#81 | 4,820,287(0.00%)#9,931 |
| 82. | El Rancho | 11 | 14,573(0.08%)#82 | 4,820,287(0.00%)#9,936 |
| 83. | Grants | 10 | 14,573(0.07%)#83 | 4,820,287(0.00%)#10,050 |
| 84. | Edgewood | 10 | 14,573(0.07%)#84 | 4,820,287(0.00%)#10,064 |
| 85. | Bosque Farms | 10 | 14,573(0.07%)#85 | 4,820,287(0.00%)#10,084 |
| 86. | Tularosa | 10 | 14,573(0.07%)#86 | 4,820,287(0.00%)#10,113 |
| 87. | Pojoaque | 10 | 14,573(0.07%)#87 | 4,820,287(0.00%)#10,126 |
| 88. | Cedar Hill | 10 | 14,573(0.07%)#88 | 4,820,287(0.00%)#10,227 |
| 89. | Cochiti Lake | 10 | 14,573(0.07%)#89 | 4,820,287(0.00%)#10,270 |
| 90. | Truchas | 10 | 14,573(0.07%)#90 | 4,820,287(0.00%)#10,280 |
| 91. | Elephant Butte | 9 | 14,573(0.06%)#91 | 4,820,287(0.00%)#10,452 |
| 92. | Cloudcroft | 9 | 14,573(0.06%)#92 | 4,820,287(0.00%)#10,524 |
| 93. | Glorieta | 9 | 14,573(0.06%)#93 | 4,820,287(0.00%)#10,556 |
| 94. | Santa Rosa | 8 | 14,573(0.05%)#94 | 4,820,287(0.00%)#10,671 |
| 95. | Logan | 8 | 14,573(0.05%)#95 | 4,820,287(0.00%)#10,805 |
| 96. | San Antonito Cdp Bernalillo County | 8 | 14,573(0.05%)#96 | 4,820,287(0.00%)#10,828 |
| 97. | Jacona | 8 | 14,573(0.05%)#97 | 4,820,287(0.00%)#10,881 |
| 98. | La Tierra | 8 | 14,573(0.05%)#98 | 4,820,287(0.00%)#10,906 |
| 99. | Paradise Hills | 7 | 14,573(0.05%)#99 | 4,820,287(0.00%)#10,963 |
| 100. | Pleasanton | 7 | 14,573(0.05%)#100 | 4,820,287(0.00%)#11,253 |
Common Questions
What are the Top 10 Cities with the Most Immigrants from Europe in New Mexico?
Top 10 Cities with the Most Immigrants from Europe in New Mexico are:
#1
5,271
#2
1,434
#3
831
#4
826
#5
439
#6
366
#7
323
#8
171
#9
140
#10
123
What city has the Most Immigrants from Europe in New Mexico?
Albuquerque has the Most Immigrants from Europe in New Mexico with 5,271.
What is the Total Immigrants from Europe in the State of New Mexico?
Total Immigrants from Europe in New Mexico is 14,573.
What is the Total Immigrants from Europe in the United States?
Total Immigrants from Europe in the United States is 4,820,287.