Cities with the Most Immigrants from Europe in North Carolina
RELATED REPORTS & OPTIONS
Europe
North Carolina
Compare Cities
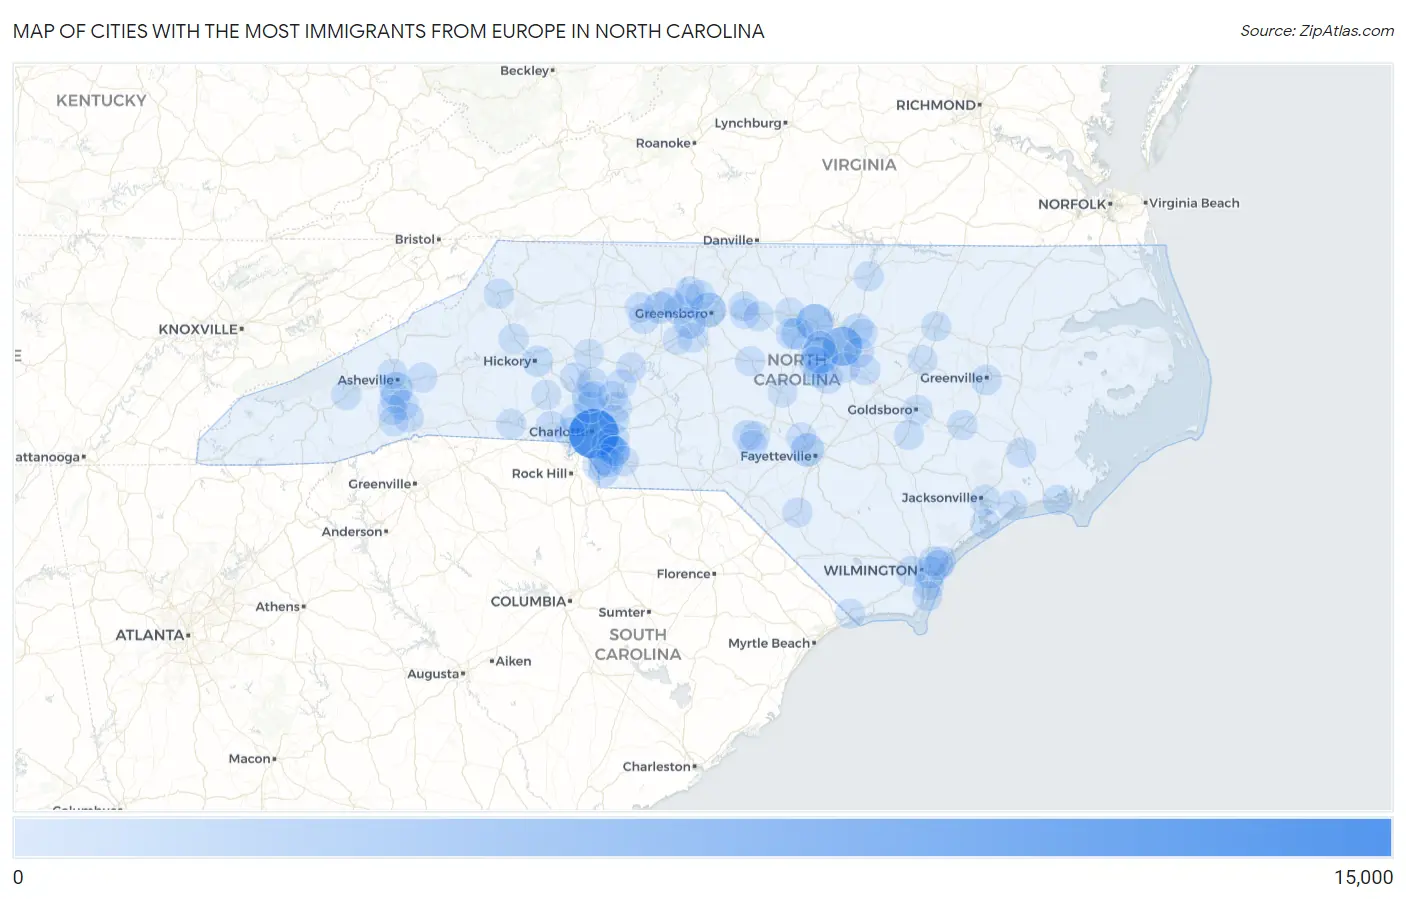
Map of Cities with the Most Immigrants from Europe in North Carolina
0
15,000
Cities with the Most Immigrants from Europe in North Carolina
| City | Europe | vs State | vs National | |
| 1. | Charlotte | 12,724 | 94,315(13.49%)#1 | 4,820,287(0.26%)#16 |
| 2. | Raleigh | 5,796 | 94,315(6.15%)#2 | 4,820,287(0.12%)#58 |
| 3. | Durham | 4,287 | 94,315(4.55%)#3 | 4,820,287(0.09%)#108 |
| 4. | Cary | 4,211 | 94,315(4.46%)#4 | 4,820,287(0.09%)#113 |
| 5. | Greensboro | 3,021 | 94,315(3.20%)#5 | 4,820,287(0.06%)#182 |
| 6. | Fayetteville | 2,138 | 94,315(2.27%)#6 | 4,820,287(0.04%)#277 |
| 7. | Asheville | 2,057 | 94,315(2.18%)#7 | 4,820,287(0.04%)#293 |
| 8. | Indian Trail | 1,494 | 94,315(1.58%)#8 | 4,820,287(0.03%)#438 |
| 9. | High Point | 1,463 | 94,315(1.55%)#9 | 4,820,287(0.03%)#453 |
| 10. | Chapel Hill | 1,451 | 94,315(1.54%)#10 | 4,820,287(0.03%)#464 |
| 11. | Winston Salem | 1,439 | 94,315(1.53%)#11 | 4,820,287(0.03%)#470 |
| 12. | Apex | 1,127 | 94,315(1.19%)#12 | 4,820,287(0.02%)#621 |
| 13. | Wilmington | 1,105 | 94,315(1.17%)#13 | 4,820,287(0.02%)#633 |
| 14. | Matthews | 1,019 | 94,315(1.08%)#14 | 4,820,287(0.02%)#684 |
| 15. | Huntersville | 946 | 94,315(1.00%)#15 | 4,820,287(0.02%)#727 |
| 16. | Cornelius | 759 | 94,315(0.80%)#16 | 4,820,287(0.02%)#896 |
| 17. | Holly Springs | 737 | 94,315(0.78%)#17 | 4,820,287(0.02%)#928 |
| 18. | Carrboro | 710 | 94,315(0.75%)#18 | 4,820,287(0.01%)#968 |
| 19. | Concord | 685 | 94,315(0.73%)#19 | 4,820,287(0.01%)#1,008 |
| 20. | Hickory | 673 | 94,315(0.71%)#20 | 4,820,287(0.01%)#1,039 |
| 21. | Mint Hill | 654 | 94,315(0.69%)#21 | 4,820,287(0.01%)#1,056 |
| 22. | Wake Forest | 650 | 94,315(0.69%)#22 | 4,820,287(0.01%)#1,065 |
| 23. | Weddington | 608 | 94,315(0.64%)#23 | 4,820,287(0.01%)#1,148 |
| 24. | Waxhaw | 564 | 94,315(0.60%)#24 | 4,820,287(0.01%)#1,241 |
| 25. | Leland | 515 | 94,315(0.55%)#25 | 4,820,287(0.01%)#1,333 |
| 26. | Mooresville | 505 | 94,315(0.54%)#26 | 4,820,287(0.01%)#1,366 |
| 27. | Greenville | 434 | 94,315(0.46%)#27 | 4,820,287(0.01%)#1,541 |
| 28. | Clayton | 424 | 94,315(0.45%)#28 | 4,820,287(0.01%)#1,577 |
| 29. | Gastonia | 422 | 94,315(0.45%)#29 | 4,820,287(0.01%)#1,586 |
| 30. | Morrisville | 407 | 94,315(0.43%)#30 | 4,820,287(0.01%)#1,652 |
| 31. | Clemmons | 407 | 94,315(0.43%)#31 | 4,820,287(0.01%)#1,655 |
| 32. | Avery Creek | 404 | 94,315(0.43%)#32 | 4,820,287(0.01%)#1,674 |
| 33. | Jacksonville | 385 | 94,315(0.41%)#33 | 4,820,287(0.01%)#1,734 |
| 34. | Kernersville | 348 | 94,315(0.37%)#34 | 4,820,287(0.01%)#1,866 |
| 35. | Pinehurst | 334 | 94,315(0.35%)#35 | 4,820,287(0.01%)#1,930 |
| 36. | Fuquay Varina | 328 | 94,315(0.35%)#36 | 4,820,287(0.01%)#1,960 |
| 37. | Kinston | 299 | 94,315(0.32%)#37 | 4,820,287(0.01%)#2,107 |
| 38. | Burlington | 286 | 94,315(0.30%)#38 | 4,820,287(0.01%)#2,166 |
| 39. | Porters Neck | 261 | 94,315(0.28%)#39 | 4,820,287(0.01%)#2,296 |
| 40. | Stallings | 256 | 94,315(0.27%)#40 | 4,820,287(0.01%)#2,334 |
| 41. | Kannapolis | 250 | 94,315(0.27%)#41 | 4,820,287(0.01%)#2,369 |
| 42. | Lewisville | 240 | 94,315(0.25%)#42 | 4,820,287(0.00%)#2,438 |
| 43. | Goldsboro | 237 | 94,315(0.25%)#43 | 4,820,287(0.00%)#2,461 |
| 44. | Harrisburg | 236 | 94,315(0.25%)#44 | 4,820,287(0.00%)#2,475 |
| 45. | Garner | 234 | 94,315(0.25%)#45 | 4,820,287(0.00%)#2,492 |
| 46. | New Bern | 229 | 94,315(0.24%)#46 | 4,820,287(0.00%)#2,536 |
| 47. | Boone | 228 | 94,315(0.24%)#47 | 4,820,287(0.00%)#2,543 |
| 48. | Davidson | 222 | 94,315(0.24%)#48 | 4,820,287(0.00%)#2,592 |
| 49. | Fletcher | 192 | 94,315(0.20%)#49 | 4,820,287(0.00%)#2,819 |
| 50. | Hendersonville | 185 | 94,315(0.20%)#50 | 4,820,287(0.00%)#2,881 |
| 51. | Wesley Chapel | 179 | 94,315(0.19%)#51 | 4,820,287(0.00%)#2,954 |
| 52. | Knightdale | 176 | 94,315(0.19%)#52 | 4,820,287(0.00%)#2,993 |
| 53. | Monroe | 170 | 94,315(0.18%)#53 | 4,820,287(0.00%)#3,051 |
| 54. | Woodfin | 167 | 94,315(0.18%)#54 | 4,820,287(0.00%)#3,097 |
| 55. | Anderson Creek | 166 | 94,315(0.18%)#55 | 4,820,287(0.00%)#3,109 |
| 56. | Black Mountain | 162 | 94,315(0.17%)#56 | 4,820,287(0.00%)#3,165 |
| 57. | Myrtle Grove | 158 | 94,315(0.17%)#57 | 4,820,287(0.00%)#3,228 |
| 58. | Salisbury | 156 | 94,315(0.17%)#58 | 4,820,287(0.00%)#3,244 |
| 59. | Shelby | 156 | 94,315(0.17%)#59 | 4,820,287(0.00%)#3,246 |
| 60. | Murraysville | 150 | 94,315(0.16%)#60 | 4,820,287(0.00%)#3,319 |
| 61. | Waynesville | 150 | 94,315(0.16%)#61 | 4,820,287(0.00%)#3,323 |
| 62. | Rocky Mount | 148 | 94,315(0.16%)#62 | 4,820,287(0.00%)#3,349 |
| 63. | Elon | 147 | 94,315(0.16%)#63 | 4,820,287(0.00%)#3,364 |
| 64. | Mills River | 147 | 94,315(0.16%)#64 | 4,820,287(0.00%)#3,370 |
| 65. | Lake Norman Of Catawba | 146 | 94,315(0.15%)#65 | 4,820,287(0.00%)#3,379 |
| 66. | Ogden | 144 | 94,315(0.15%)#66 | 4,820,287(0.00%)#3,407 |
| 67. | Lenoir | 143 | 94,315(0.15%)#67 | 4,820,287(0.00%)#3,418 |
| 68. | Spring Lake | 143 | 94,315(0.15%)#68 | 4,820,287(0.00%)#3,419 |
| 69. | Carolina Beach | 139 | 94,315(0.15%)#69 | 4,820,287(0.00%)#3,480 |
| 70. | Mount Olive | 139 | 94,315(0.15%)#70 | 4,820,287(0.00%)#3,485 |
| 71. | Graham | 138 | 94,315(0.15%)#71 | 4,820,287(0.00%)#3,494 |
| 72. | Archdale | 129 | 94,315(0.14%)#72 | 4,820,287(0.00%)#3,618 |
| 73. | Oak Ridge | 129 | 94,315(0.14%)#73 | 4,820,287(0.00%)#3,624 |
| 74. | Lake Park | 129 | 94,315(0.14%)#74 | 4,820,287(0.00%)#3,629 |
| 75. | Belmont | 128 | 94,315(0.14%)#75 | 4,820,287(0.00%)#3,641 |
| 76. | Lumberton | 124 | 94,315(0.13%)#76 | 4,820,287(0.00%)#3,711 |
| 77. | Stokesdale | 123 | 94,315(0.13%)#77 | 4,820,287(0.00%)#3,734 |
| 78. | Southern Pines | 122 | 94,315(0.13%)#78 | 4,820,287(0.00%)#3,748 |
| 79. | Henderson | 121 | 94,315(0.13%)#79 | 4,820,287(0.00%)#3,769 |
| 80. | Rolesville | 121 | 94,315(0.13%)#80 | 4,820,287(0.00%)#3,772 |
| 81. | Morehead City | 119 | 94,315(0.13%)#81 | 4,820,287(0.00%)#3,812 |
| 82. | Etowah | 119 | 94,315(0.13%)#82 | 4,820,287(0.00%)#3,815 |
| 83. | Walkertown | 116 | 94,315(0.12%)#83 | 4,820,287(0.00%)#3,859 |
| 84. | Siler City | 115 | 94,315(0.12%)#84 | 4,820,287(0.00%)#3,871 |
| 85. | Marvin | 112 | 94,315(0.12%)#85 | 4,820,287(0.00%)#3,929 |
| 86. | Spout Springs | 109 | 94,315(0.12%)#86 | 4,820,287(0.00%)#3,975 |
| 87. | Wilson | 106 | 94,315(0.11%)#87 | 4,820,287(0.00%)#4,035 |
| 88. | Statesville | 103 | 94,315(0.11%)#88 | 4,820,287(0.00%)#4,108 |
| 89. | Briar Chapel | 103 | 94,315(0.11%)#89 | 4,820,287(0.00%)#4,124 |
| 90. | Carolina Shores | 103 | 94,315(0.11%)#90 | 4,820,287(0.00%)#4,126 |
| 91. | Summerfield | 98 | 94,315(0.10%)#91 | 4,820,287(0.00%)#4,229 |
| 92. | Lincolnton | 97 | 94,315(0.10%)#92 | 4,820,287(0.00%)#4,253 |
| 93. | Mount Holly | 95 | 94,315(0.10%)#93 | 4,820,287(0.00%)#4,294 |
| 94. | Sneads Ferry | 92 | 94,315(0.10%)#94 | 4,820,287(0.00%)#4,390 |
| 95. | Aberdeen | 90 | 94,315(0.10%)#95 | 4,820,287(0.00%)#4,433 |
| 96. | China Grove | 90 | 94,315(0.10%)#96 | 4,820,287(0.00%)#4,442 |
| 97. | Hillsborough | 89 | 94,315(0.09%)#97 | 4,820,287(0.00%)#4,456 |
| 98. | Swansboro | 85 | 94,315(0.09%)#98 | 4,820,287(0.00%)#4,578 |
| 99. | Sanford | 84 | 94,315(0.09%)#99 | 4,820,287(0.00%)#4,588 |
| 100. | Thomasville | 83 | 94,315(0.09%)#100 | 4,820,287(0.00%)#4,616 |
Common Questions
What are the Top 10 Cities with the Most Immigrants from Europe in North Carolina?
Top 10 Cities with the Most Immigrants from Europe in North Carolina are:
#1
12,724
#2
5,796
#3
4,287
#4
4,211
#5
3,021
#6
2,138
#7
2,057
#8
1,494
#9
1,463
#10
1,451
What city has the Most Immigrants from Europe in North Carolina?
Charlotte has the Most Immigrants from Europe in North Carolina with 12,724.
What is the Total Immigrants from Europe in the State of North Carolina?
Total Immigrants from Europe in North Carolina is 94,315.
What is the Total Immigrants from Europe in the United States?
Total Immigrants from Europe in the United States is 4,820,287.