Cities with the Lowest Child Poverty Level Among Girls Under the Age of 16 in Virginia
RELATED REPORTS & OPTIONS
Lowest Poverty | Girls 0-16
Virginia
Compare Cities
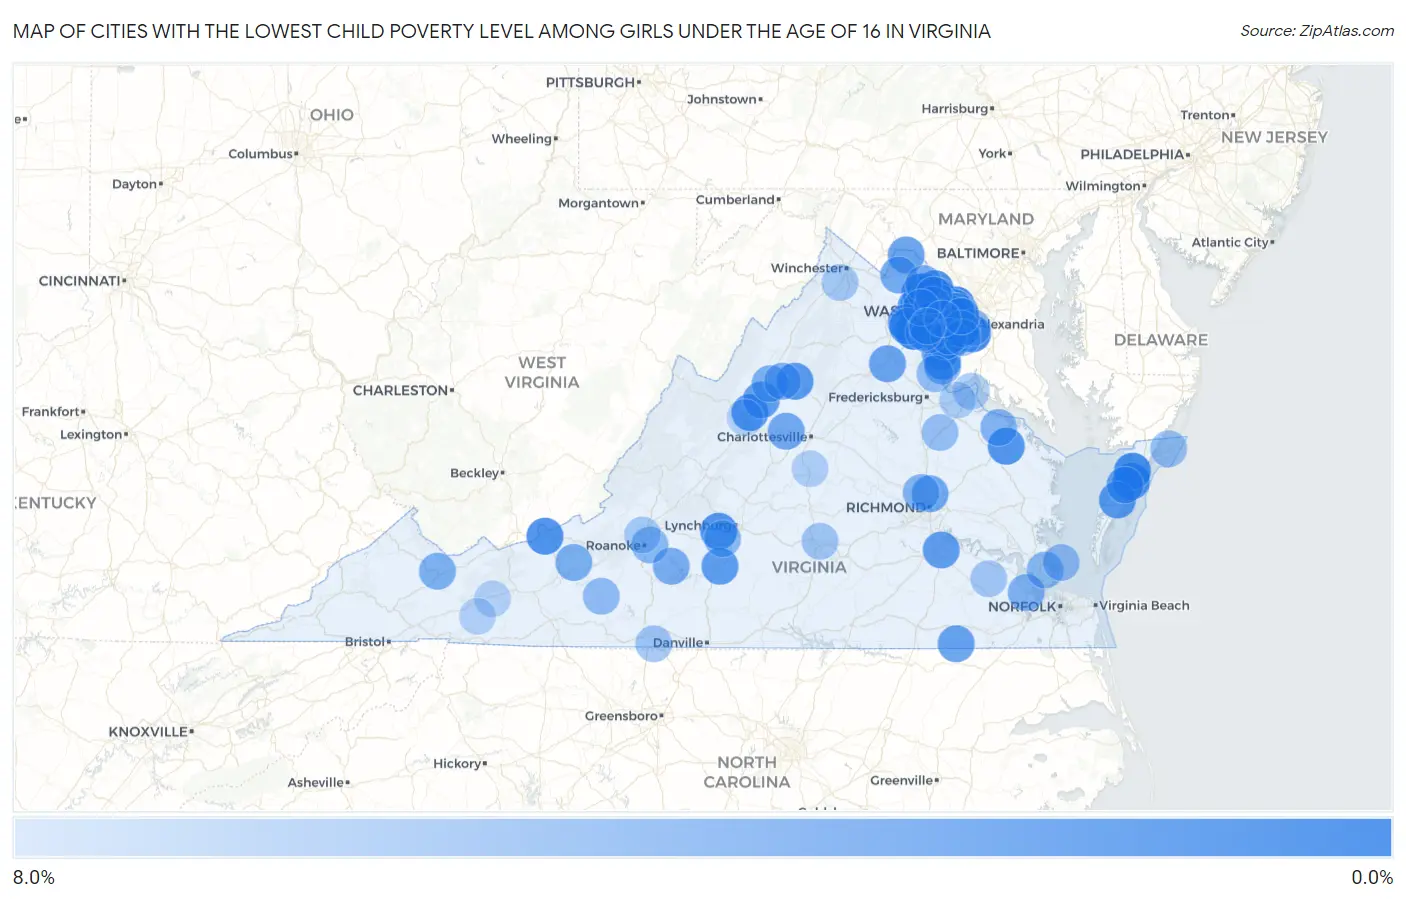
Map of Cities with the Lowest Child Poverty Level Among Girls Under the Age of 16 in Virginia
8.0%
0.0%
Cities with the Lowest Child Poverty Level Among Girls Under the Age of 16 in Virginia
| City | Child Poverty (Girls) | vs State | vs National | |
| 1. | Linton Hall | 0.28% | 13.1%(-12.8)#1 | 17.0%(-16.7)#11 |
| 2. | Fairfax Station | 0.57% | 13.1%(-12.5)#2 | 17.0%(-16.4)#55 |
| 3. | Mclean | 0.76% | 13.1%(-12.3)#3 | 17.0%(-16.2)#87 |
| 4. | Wolf Trap | 0.76% | 13.1%(-12.3)#4 | 17.0%(-16.2)#88 |
| 5. | Falls Church | 0.86% | 13.1%(-12.2)#5 | 17.0%(-16.1)#112 |
| 6. | Fort Hunt | 0.98% | 13.1%(-12.1)#6 | 17.0%(-16.0)#158 |
| 7. | Franklin Farm | 1.0% | 13.1%(-12.0)#7 | 17.0%(-15.9)#177 |
| 8. | Accomac | 1.1% | 13.1%(-12.0)#8 | 17.0%(-15.9)#184 |
| 9. | Burke | 1.1% | 13.1%(-12.0)#9 | 17.0%(-15.8)#207 |
| 10. | Parksley | 1.1% | 13.1%(-11.9)#10 | 17.0%(-15.8)#217 |
| 11. | Cascades | 1.3% | 13.1%(-11.8)#11 | 17.0%(-15.7)#266 |
| 12. | Midlothian | 1.3% | 13.1%(-11.8)#12 | 17.0%(-15.7)#271 |
| 13. | Pimmit Hills | 1.4% | 13.1%(-11.7)#13 | 17.0%(-15.6)#305 |
| 14. | Broadlands | 1.5% | 13.1%(-11.6)#14 | 17.0%(-15.5)#340 |
| 15. | Oakton | 1.5% | 13.1%(-11.5)#15 | 17.0%(-15.4)#369 |
| 16. | Narrows | 1.6% | 13.1%(-11.5)#16 | 17.0%(-15.4)#374 |
| 17. | Newington | 1.6% | 13.1%(-11.5)#17 | 17.0%(-15.4)#402 |
| 18. | Dranesville | 1.7% | 13.1%(-11.4)#18 | 17.0%(-15.3)#415 |
| 19. | Stone Ridge | 1.7% | 13.1%(-11.4)#19 | 17.0%(-15.3)#417 |
| 20. | Arcola | 1.8% | 13.1%(-11.3)#20 | 17.0%(-15.2)#484 |
| 21. | Forest | 1.8% | 13.1%(-11.3)#21 | 17.0%(-15.2)#485 |
| 22. | Warsaw | 1.8% | 13.1%(-11.3)#22 | 17.0%(-15.2)#494 |
| 23. | Verona | 1.8% | 13.1%(-11.3)#23 | 17.0%(-15.2)#501 |
| 24. | Triangle | 1.9% | 13.1%(-11.2)#24 | 17.0%(-15.1)#534 |
| 25. | Laurel Hill | 1.9% | 13.1%(-11.2)#25 | 17.0%(-15.1)#539 |
| 26. | Loudoun Valley Estates | 2.0% | 13.1%(-11.1)#26 | 17.0%(-15.0)#601 |
| 27. | Haymarket | 2.1% | 13.1%(-11.0)#27 | 17.0%(-14.9)#620 |
| 28. | Painter | 2.1% | 13.1%(-11.0)#28 | 17.0%(-14.9)#643 |
| 29. | Elkton | 2.1% | 13.1%(-11.0)#29 | 17.0%(-14.9)#663 |
| 30. | Altavista | 2.2% | 13.1%(-10.8)#30 | 17.0%(-14.7)#731 |
| 31. | Burke Centre | 2.3% | 13.1%(-10.8)#31 | 17.0%(-14.7)#746 |
| 32. | Leesylvania | 2.4% | 13.1%(-10.7)#32 | 17.0%(-14.6)#807 |
| 33. | Weyers Cave | 2.5% | 13.1%(-10.6)#33 | 17.0%(-14.5)#877 |
| 34. | Fort Lee | 2.5% | 13.1%(-10.6)#34 | 17.0%(-14.5)#879 |
| 35. | Fair Oaks | 2.6% | 13.1%(-10.5)#35 | 17.0%(-14.4)#935 |
| 36. | Gainesville | 2.6% | 13.1%(-10.4)#36 | 17.0%(-14.3)#957 |
| 37. | Tysons | 2.8% | 13.1%(-10.3)#37 | 17.0%(-14.2)#1,053 |
| 38. | Kings Park West | 2.8% | 13.1%(-10.2)#38 | 17.0%(-14.1)#1,078 |
| 39. | Boykins | 2.9% | 13.1%(-10.1)#39 | 17.0%(-14.0)#1,145 |
| 40. | Lovettsville | 3.0% | 13.1%(-10.1)#40 | 17.0%(-14.0)#1,156 |
| 41. | Onley | 3.0% | 13.1%(-10.1)#41 | 17.0%(-13.9)#1,195 |
| 42. | Remington | 3.1% | 13.1%(-10.0)#42 | 17.0%(-13.9)#1,208 |
| 43. | Manassas Park | 3.2% | 13.1%(-9.84)#43 | 17.0%(-13.7)#1,322 |
| 44. | Chamberlayne | 3.4% | 13.1%(-9.73)#44 | 17.0%(-13.6)#1,400 |
| 45. | Crozet | 3.4% | 13.1%(-9.64)#45 | 17.0%(-13.5)#1,453 |
| 46. | Dunn Loring | 3.5% | 13.1%(-9.56)#46 | 17.0%(-13.5)#1,500 |
| 47. | Vienna | 3.5% | 13.1%(-9.54)#47 | 17.0%(-13.4)#1,516 |
| 48. | Montclair | 3.6% | 13.1%(-9.53)#48 | 17.0%(-13.4)#1,525 |
| 49. | Ashburn | 3.6% | 13.1%(-9.53)#49 | 17.0%(-13.4)#1,526 |
| 50. | Kingstowne | 3.7% | 13.1%(-9.35)#50 | 17.0%(-13.2)#1,619 |
| 51. | Purcellville | 3.8% | 13.1%(-9.31)#51 | 17.0%(-13.2)#1,638 |
| 52. | West Falls Church | 3.8% | 13.1%(-9.30)#52 | 17.0%(-13.2)#1,651 |
| 53. | Westlake Corner | 3.9% | 13.1%(-9.16)#53 | 17.0%(-13.1)#1,744 |
| 54. | Fairlawn | 4.0% | 13.1%(-9.06)#54 | 17.0%(-13.0)#1,804 |
| 55. | Massanetta Springs | 4.1% | 13.1%(-9.03)#55 | 17.0%(-12.9)#1,819 |
| 56. | West Springfield | 4.1% | 13.1%(-9.03)#56 | 17.0%(-12.9)#1,820 |
| 57. | Newington Forest | 4.1% | 13.1%(-9.00)#57 | 17.0%(-12.9)#1,840 |
| 58. | Reston | 4.1% | 13.1%(-8.99)#58 | 17.0%(-12.9)#1,847 |
| 59. | Massanutten | 4.2% | 13.1%(-8.92)#59 | 17.0%(-12.8)#1,891 |
| 60. | Cedar Bluff | 4.2% | 13.1%(-8.92)#60 | 17.0%(-12.8)#1,895 |
| 61. | Benns Church | 4.3% | 13.1%(-8.81)#61 | 17.0%(-12.7)#1,975 |
| 62. | Lansdowne | 4.4% | 13.1%(-8.73)#62 | 17.0%(-12.6)#2,033 |
| 63. | Montross | 4.5% | 13.1%(-8.54)#63 | 17.0%(-12.4)#2,159 |
| 64. | Merrifield | 4.6% | 13.1%(-8.46)#64 | 17.0%(-12.4)#2,205 |
| 65. | Laurel | 4.6% | 13.1%(-8.45)#65 | 17.0%(-12.3)#2,214 |
| 66. | Belle Haven | 4.6% | 13.1%(-8.44)#66 | 17.0%(-12.3)#2,219 |
| 67. | Idylwood | 4.7% | 13.1%(-8.35)#67 | 17.0%(-12.2)#2,268 |
| 68. | Quantico Base | 4.7% | 13.1%(-8.34)#68 | 17.0%(-12.2)#2,272 |
| 69. | Lake Ridge | 4.9% | 13.1%(-8.21)#69 | 17.0%(-12.1)#2,359 |
| 70. | Vinton | 4.9% | 13.1%(-8.15)#70 | 17.0%(-12.0)#2,400 |
| 71. | Bethel Manor | 5.0% | 13.1%(-8.13)#71 | 17.0%(-12.0)#2,416 |
| 72. | Timberlake | 5.0% | 13.1%(-8.12)#72 | 17.0%(-12.0)#2,422 |
| 73. | Buckhall | 5.0% | 13.1%(-8.06)#73 | 17.0%(-12.0)#2,474 |
| 74. | Floris | 5.2% | 13.1%(-7.85)#74 | 17.0%(-11.7)#2,593 |
| 75. | Floyd | 5.3% | 13.1%(-7.82)#75 | 17.0%(-11.7)#2,616 |
| 76. | Poquoson | 5.3% | 13.1%(-7.81)#76 | 17.0%(-11.7)#2,626 |
| 77. | Sterling | 5.3% | 13.1%(-7.79)#77 | 17.0%(-11.7)#2,631 |
| 78. | Franconia | 5.3% | 13.1%(-7.75)#78 | 17.0%(-11.6)#2,646 |
| 79. | Aquia Harbour | 5.4% | 13.1%(-7.70)#79 | 17.0%(-11.6)#2,678 |
| 80. | Bowling Green | 5.5% | 13.1%(-7.59)#80 | 17.0%(-11.5)#2,723 |
| 81. | Crosspointe | 5.5% | 13.1%(-7.57)#81 | 17.0%(-11.5)#2,737 |
| 82. | Chincoteague | 5.7% | 13.1%(-7.42)#82 | 17.0%(-11.3)#2,824 |
| 83. | Ridgeway | 6.0% | 13.1%(-7.07)#83 | 17.0%(-11.0)#3,027 |
| 84. | Manassas | 6.1% | 13.1%(-7.03)#84 | 17.0%(-10.9)#3,045 |
| 85. | Farmville | 6.1% | 13.1%(-6.94)#85 | 17.0%(-10.8)#3,107 |
| 86. | South Riding | 6.2% | 13.1%(-6.85)#86 | 17.0%(-10.7)#3,152 |
| 87. | Dendron | 6.2% | 13.1%(-6.83)#87 | 17.0%(-10.7)#3,186 |
| 88. | Stephens City | 6.3% | 13.1%(-6.79)#88 | 17.0%(-10.7)#3,208 |
| 89. | Fort Belvoir | 6.3% | 13.1%(-6.75)#89 | 17.0%(-10.6)#3,219 |
| 90. | Lake Barcroft | 6.4% | 13.1%(-6.71)#90 | 17.0%(-10.6)#3,229 |
| 91. | Hollins | 6.5% | 13.1%(-6.60)#91 | 17.0%(-10.5)#3,290 |
| 92. | Dahlgren | 6.5% | 13.1%(-6.55)#92 | 17.0%(-10.4)#3,321 |
| 93. | Sully Square | 6.8% | 13.1%(-6.28)#93 | 17.0%(-10.2)#3,505 |
| 94. | King George | 6.8% | 13.1%(-6.25)#94 | 17.0%(-10.1)#3,519 |
| 95. | Scottsville | 6.9% | 13.1%(-6.14)#95 | 17.0%(-10.0)#3,584 |
| 96. | George Mason | 7.0% | 13.1%(-6.08)#96 | 17.0%(-9.97)#3,621 |
| 97. | Rural Retreat | 7.1% | 13.1%(-5.94)#97 | 17.0%(-9.83)#3,697 |
| 98. | Sugar Grove | 7.1% | 13.1%(-5.94)#98 | 17.0%(-9.83)#3,704 |
| 99. | Staunton | 7.2% | 13.1%(-5.90)#99 | 17.0%(-9.79)#3,741 |
| 100. | Yorkshire | 7.4% | 13.1%(-5.68)#100 | 17.0%(-9.58)#3,858 |
Common Questions
What are the Top 10 Cities with the Lowest Child Poverty Level Among Girls Under the Age of 16 in Virginia?
Top 10 Cities with the Lowest Child Poverty Level Among Girls Under the Age of 16 in Virginia are:
#1
0.28%
#2
0.57%
#3
0.76%
#4
0.76%
#5
0.86%
#6
0.98%
#7
1.0%
#8
1.1%
#9
1.1%
#10
1.1%
What city has the Lowest Child Poverty Level Among Girls Under the Age of 16 in Virginia?
Linton Hall has the Lowest Child Poverty Level Among Girls Under the Age of 16 in Virginia with 0.28%.
What is the Poverty Level Among Girls Under the Age of 16 in the State of Virginia?
Poverty Level Among Girls Under the Age of 16 in Virginia is 13.1%.
What is the Poverty Level Among Girls Under the Age of 16 in the United States?
Poverty Level Among Girls Under the Age of 16 in the United States is 17.0%.