Cities with the Lowest Child Poverty Level Among Girls Under the Age of 16 in Illinois
RELATED REPORTS & OPTIONS
Lowest Poverty | Girls 0-16
Illinois
Compare Cities
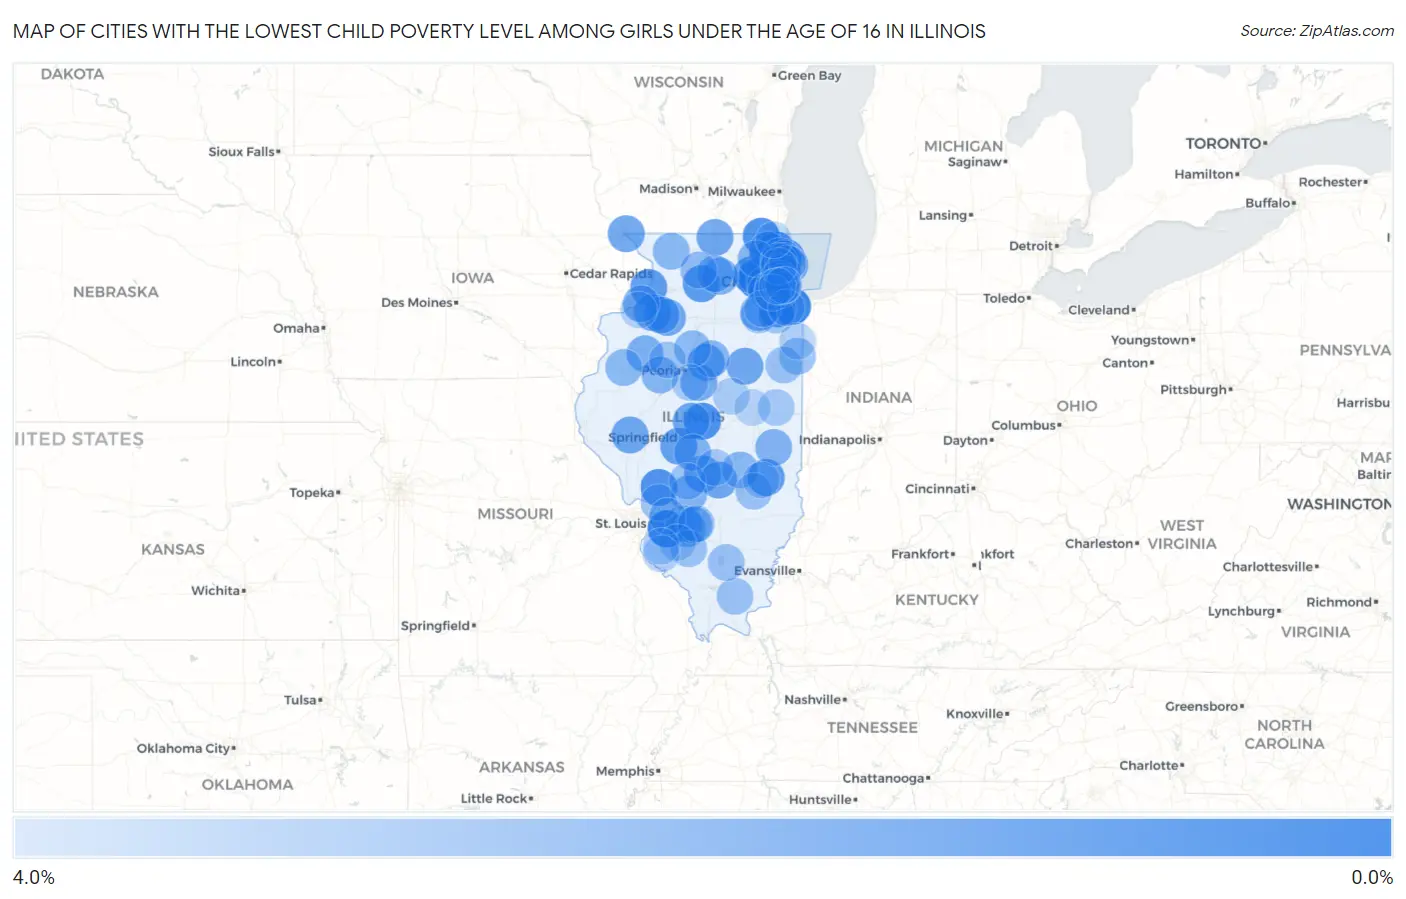
Map of Cities with the Lowest Child Poverty Level Among Girls Under the Age of 16 in Illinois
4.0%
0.0%
Cities with the Lowest Child Poverty Level Among Girls Under the Age of 16 in Illinois
| City | Child Poverty (Girls) | vs State | vs National | |
| 1. | Shiloh | 0.38% | 16.0%(-15.6)#1 | 17.0%(-16.6)#24 |
| 2. | Flossmoor | 0.50% | 16.0%(-15.5)#2 | 17.0%(-16.5)#41 |
| 3. | Hinsdale | 0.51% | 16.0%(-15.5)#3 | 17.0%(-16.5)#43 |
| 4. | Lemont | 0.53% | 16.0%(-15.5)#4 | 17.0%(-16.4)#46 |
| 5. | Geneva | 0.53% | 16.0%(-15.5)#5 | 17.0%(-16.4)#47 |
| 6. | La Grange Park | 0.75% | 16.0%(-15.2)#6 | 17.0%(-16.2)#84 |
| 7. | Mount Pulaski | 0.87% | 16.0%(-15.1)#7 | 17.0%(-16.1)#117 |
| 8. | Libertyville | 0.88% | 16.0%(-15.1)#8 | 17.0%(-16.1)#125 |
| 9. | Spring Grove | 0.89% | 16.0%(-15.1)#9 | 17.0%(-16.1)#128 |
| 10. | New Lenox | 0.94% | 16.0%(-15.0)#10 | 17.0%(-16.0)#142 |
| 11. | Shipman | 0.94% | 16.0%(-15.0)#11 | 17.0%(-16.0)#145 |
| 12. | Campton Hills | 1.1% | 16.0%(-14.9)#12 | 17.0%(-15.9)#200 |
| 13. | Highland Park | 1.2% | 16.0%(-14.8)#13 | 17.0%(-15.8)#238 |
| 14. | Albany | 1.2% | 16.0%(-14.8)#14 | 17.0%(-15.7)#243 |
| 15. | Barrington | 1.3% | 16.0%(-14.7)#15 | 17.0%(-15.7)#247 |
| 16. | Greenup | 1.3% | 16.0%(-14.7)#16 | 17.0%(-15.7)#264 |
| 17. | Franklin Grove | 1.3% | 16.0%(-14.7)#17 | 17.0%(-15.7)#277 |
| 18. | Bartlett | 1.4% | 16.0%(-14.6)#18 | 17.0%(-15.6)#324 |
| 19. | Chatham | 1.4% | 16.0%(-14.6)#19 | 17.0%(-15.6)#325 |
| 20. | Geneseo | 1.6% | 16.0%(-14.4)#20 | 17.0%(-15.4)#383 |
| 21. | Hillside | 1.6% | 16.0%(-14.4)#21 | 17.0%(-15.4)#384 |
| 22. | Nokomis | 1.6% | 16.0%(-14.4)#22 | 17.0%(-15.4)#400 |
| 23. | St Charles | 1.7% | 16.0%(-14.3)#23 | 17.0%(-15.3)#419 |
| 24. | East Dubuque | 1.7% | 16.0%(-14.3)#24 | 17.0%(-15.3)#423 |
| 25. | Burr Ridge | 1.7% | 16.0%(-14.3)#25 | 17.0%(-15.3)#434 |
| 26. | Fairbury | 1.7% | 16.0%(-14.3)#26 | 17.0%(-15.3)#435 |
| 27. | Meredosia | 1.7% | 16.0%(-14.3)#27 | 17.0%(-15.3)#440 |
| 28. | Rockton | 1.7% | 16.0%(-14.3)#28 | 17.0%(-15.3)#442 |
| 29. | Elkhart | 1.7% | 16.0%(-14.3)#29 | 17.0%(-15.3)#452 |
| 30. | Herrick | 1.7% | 16.0%(-14.3)#30 | 17.0%(-15.3)#453 |
| 31. | Roanoke | 1.8% | 16.0%(-14.2)#31 | 17.0%(-15.2)#488 |
| 32. | Annawan | 1.8% | 16.0%(-14.2)#32 | 17.0%(-15.2)#490 |
| 33. | Minooka | 1.8% | 16.0%(-14.2)#33 | 17.0%(-15.1)#506 |
| 34. | Atkinson | 1.8% | 16.0%(-14.2)#34 | 17.0%(-15.1)#509 |
| 35. | Wauconda | 1.8% | 16.0%(-14.1)#35 | 17.0%(-15.1)#516 |
| 36. | Mackinaw | 1.9% | 16.0%(-14.1)#36 | 17.0%(-15.1)#540 |
| 37. | Rapids City | 2.0% | 16.0%(-14.0)#37 | 17.0%(-15.0)#569 |
| 38. | Wilmette | 2.0% | 16.0%(-14.0)#38 | 17.0%(-15.0)#578 |
| 39. | Lincolnshire | 2.0% | 16.0%(-14.0)#39 | 17.0%(-15.0)#596 |
| 40. | Knoxville | 2.0% | 16.0%(-14.0)#40 | 17.0%(-15.0)#597 |
| 41. | Creston | 2.0% | 16.0%(-13.9)#41 | 17.0%(-14.9)#609 |
| 42. | Warrenville | 2.1% | 16.0%(-13.9)#42 | 17.0%(-14.9)#645 |
| 43. | Tovey | 2.1% | 16.0%(-13.9)#43 | 17.0%(-14.9)#650 |
| 44. | Deerfield | 2.1% | 16.0%(-13.9)#44 | 17.0%(-14.9)#665 |
| 45. | Oakland | 2.2% | 16.0%(-13.8)#45 | 17.0%(-14.8)#684 |
| 46. | Panama | 2.2% | 16.0%(-13.8)#46 | 17.0%(-14.8)#725 |
| 47. | Hillcrest | 2.2% | 16.0%(-13.7)#47 | 17.0%(-14.7)#730 |
| 48. | La Grange | 2.3% | 16.0%(-13.7)#48 | 17.0%(-14.7)#751 |
| 49. | Norris | 2.3% | 16.0%(-13.7)#49 | 17.0%(-14.7)#758 |
| 50. | Algonquin | 2.3% | 16.0%(-13.7)#50 | 17.0%(-14.7)#763 |
| 51. | Germantown | 2.3% | 16.0%(-13.7)#51 | 17.0%(-14.7)#781 |
| 52. | Benson | 2.3% | 16.0%(-13.7)#52 | 17.0%(-14.7)#784 |
| 53. | Aviston | 2.3% | 16.0%(-13.7)#53 | 17.0%(-14.6)#786 |
| 54. | Beckemeyer | 2.4% | 16.0%(-13.6)#54 | 17.0%(-14.6)#811 |
| 55. | Pearl City | 2.4% | 16.0%(-13.6)#55 | 17.0%(-14.6)#812 |
| 56. | Strasburg | 2.4% | 16.0%(-13.6)#56 | 17.0%(-14.6)#814 |
| 57. | Roseville | 2.4% | 16.0%(-13.6)#57 | 17.0%(-14.6)#825 |
| 58. | Hopewell | 2.4% | 16.0%(-13.5)#58 | 17.0%(-14.5)#844 |
| 59. | Park Ridge | 2.5% | 16.0%(-13.5)#59 | 17.0%(-14.5)#870 |
| 60. | Northbrook | 2.5% | 16.0%(-13.5)#60 | 17.0%(-14.5)#880 |
| 61. | Wheeling | 2.5% | 16.0%(-13.5)#61 | 17.0%(-14.5)#895 |
| 62. | Oregon | 2.5% | 16.0%(-13.4)#62 | 17.0%(-14.4)#911 |
| 63. | Rosemont | 2.6% | 16.0%(-13.4)#63 | 17.0%(-14.4)#913 |
| 64. | Naperville | 2.7% | 16.0%(-13.3)#64 | 17.0%(-14.3)#986 |
| 65. | Donovan | 2.7% | 16.0%(-13.3)#65 | 17.0%(-14.3)#997 |
| 66. | Westchester | 2.7% | 16.0%(-13.3)#66 | 17.0%(-14.2)#1,007 |
| 67. | Dieterich | 2.7% | 16.0%(-13.2)#67 | 17.0%(-14.2)#1,015 |
| 68. | Bethalto | 2.7% | 16.0%(-13.2)#68 | 17.0%(-14.2)#1,018 |
| 69. | Elmhurst | 2.8% | 16.0%(-13.2)#69 | 17.0%(-14.2)#1,023 |
| 70. | Troy | 2.8% | 16.0%(-13.2)#70 | 17.0%(-14.2)#1,024 |
| 71. | Downers Grove | 2.8% | 16.0%(-13.2)#71 | 17.0%(-14.2)#1,027 |
| 72. | Crescent City | 2.8% | 16.0%(-13.2)#72 | 17.0%(-14.2)#1,043 |
| 73. | Stonefort | 2.8% | 16.0%(-13.2)#74 | 17.0%(-14.2)#1,045 |
| 74. | Ewing | 2.8% | 16.0%(-13.2)#75 | 17.0%(-14.2)#1,046 |
| 75. | Oakdale | 2.8% | 16.0%(-13.2)#76 | 17.0%(-14.2)#1,049 |
| 76. | Carlyle | 2.9% | 16.0%(-13.1)#77 | 17.0%(-14.1)#1,083 |
| 77. | Butler | 2.9% | 16.0%(-13.1)#78 | 17.0%(-14.1)#1,089 |
| 78. | Manhattan | 2.9% | 16.0%(-13.1)#79 | 17.0%(-14.1)#1,091 |
| 79. | Northfield | 2.9% | 16.0%(-13.1)#80 | 17.0%(-14.1)#1,107 |
| 80. | Brimfield | 2.9% | 16.0%(-13.1)#81 | 17.0%(-14.1)#1,112 |
| 81. | Royal | 3.0% | 16.0%(-13.0)#82 | 17.0%(-13.9)#1,198 |
| 82. | Pana | 3.0% | 16.0%(-12.9)#83 | 17.0%(-13.9)#1,202 |
| 83. | Channahon | 3.1% | 16.0%(-12.9)#84 | 17.0%(-13.9)#1,228 |
| 84. | Tremont | 3.1% | 16.0%(-12.9)#85 | 17.0%(-13.9)#1,239 |
| 85. | Shorewood | 3.1% | 16.0%(-12.8)#86 | 17.0%(-13.8)#1,257 |
| 86. | Western Springs | 3.2% | 16.0%(-12.8)#87 | 17.0%(-13.8)#1,277 |
| 87. | Le Roy | 3.2% | 16.0%(-12.8)#88 | 17.0%(-13.8)#1,281 |
| 88. | St Libory | 3.2% | 16.0%(-12.8)#89 | 17.0%(-13.8)#1,304 |
| 89. | Jewett | 3.2% | 16.0%(-12.8)#90 | 17.0%(-13.8)#1,313 |
| 90. | Red Bud | 3.3% | 16.0%(-12.7)#91 | 17.0%(-13.7)#1,337 |
| 91. | Mount Prospect | 3.3% | 16.0%(-12.7)#92 | 17.0%(-13.7)#1,346 |
| 92. | Hecker | 3.3% | 16.0%(-12.7)#93 | 17.0%(-13.7)#1,354 |
| 93. | Woodridge | 3.3% | 16.0%(-12.7)#94 | 17.0%(-13.7)#1,363 |
| 94. | Hopkins Park | 3.3% | 16.0%(-12.7)#95 | 17.0%(-13.6)#1,391 |
| 95. | Silvis | 3.3% | 16.0%(-12.6)#96 | 17.0%(-13.6)#1,399 |
| 96. | Frankfort Square | 3.4% | 16.0%(-12.6)#97 | 17.0%(-13.6)#1,402 |
| 97. | Lindenhurst | 3.4% | 16.0%(-12.6)#98 | 17.0%(-13.6)#1,418 |
| 98. | Brookfield | 3.4% | 16.0%(-12.6)#99 | 17.0%(-13.6)#1,427 |
| 99. | Clarendon Hills | 3.4% | 16.0%(-12.5)#100 | 17.0%(-13.5)#1,452 |
| 100. | Mahomet | 3.4% | 16.0%(-12.5)#101 | 17.0%(-13.5)#1,454 |
Common Questions
What are the Top 10 Cities with the Lowest Child Poverty Level Among Girls Under the Age of 16 in Illinois?
Top 10 Cities with the Lowest Child Poverty Level Among Girls Under the Age of 16 in Illinois are:
#1
0.38%
#2
0.50%
#3
0.51%
#4
0.53%
#5
0.53%
#6
0.75%
#7
0.87%
#8
0.88%
#9
0.89%
#10
0.94%
What city has the Lowest Child Poverty Level Among Girls Under the Age of 16 in Illinois?
Shiloh has the Lowest Child Poverty Level Among Girls Under the Age of 16 in Illinois with 0.38%.
What is the Poverty Level Among Girls Under the Age of 16 in the State of Illinois?
Poverty Level Among Girls Under the Age of 16 in Illinois is 16.0%.
What is the Poverty Level Among Girls Under the Age of 16 in the United States?
Poverty Level Among Girls Under the Age of 16 in the United States is 17.0%.