Cities with the Lowest Child Poverty Level Among Girls Under the Age of 16 in Texas
RELATED REPORTS & OPTIONS
Lowest Poverty | Girls 0-16
Texas
Compare Cities
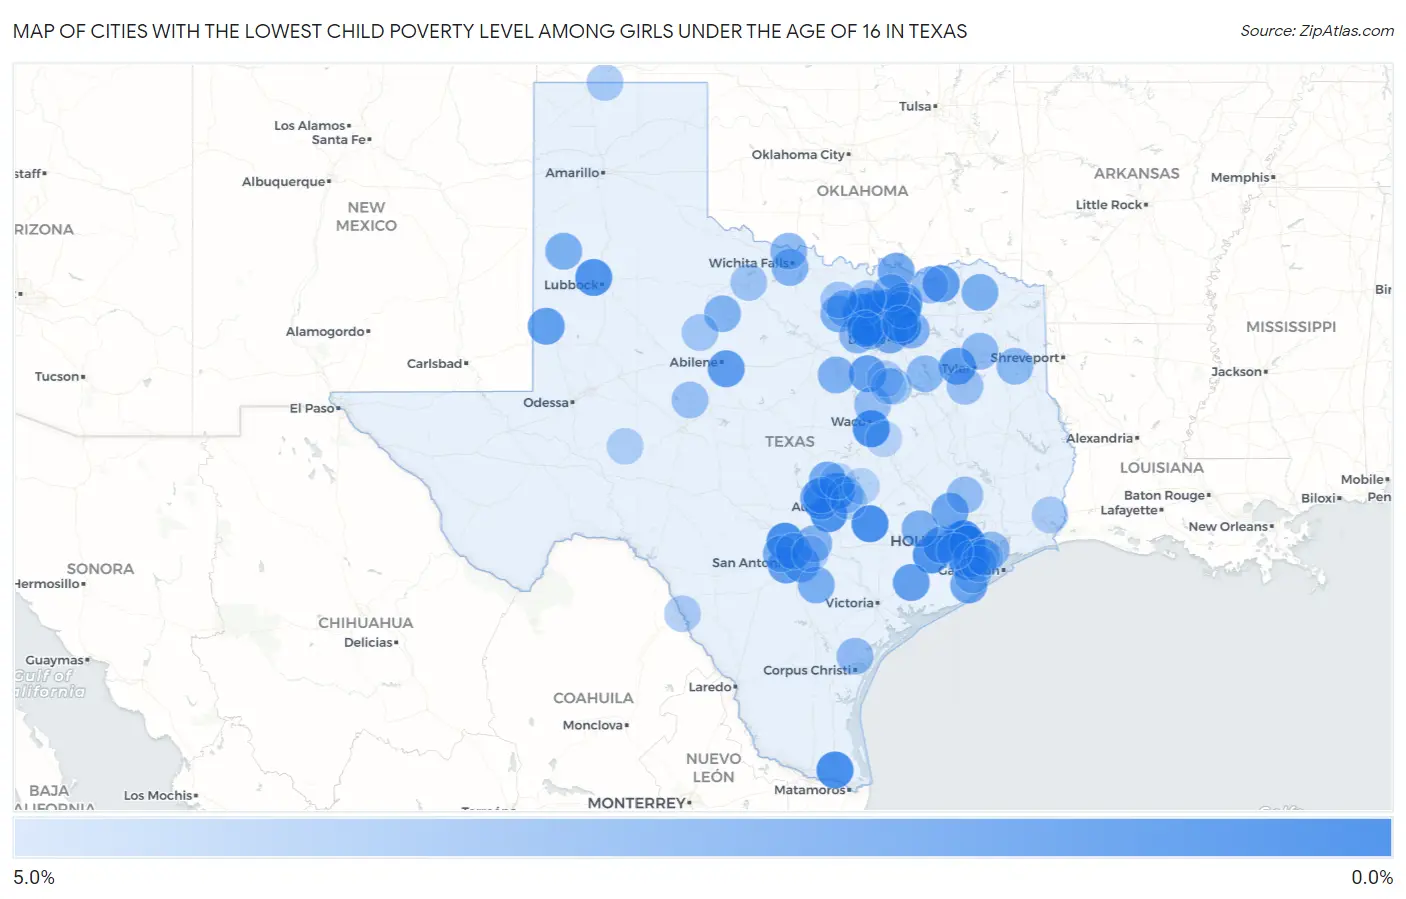
Map of Cities with the Lowest Child Poverty Level Among Girls Under the Age of 16 in Texas
5.0%
0.0%
Cities with the Lowest Child Poverty Level Among Girls Under the Age of 16 in Texas
| City | Child Poverty (Girls) | vs State | vs National | |
| 1. | Sachse | 0.32% | 19.7%(-19.4)#1 | 17.0%(-16.7)#16 |
| 2. | Westlake | 0.68% | 19.7%(-19.0)#2 | 17.0%(-16.3)#71 |
| 3. | Ponder | 0.68% | 19.7%(-19.0)#3 | 17.0%(-16.3)#72 |
| 4. | Lake Dallas | 0.81% | 19.7%(-18.9)#4 | 17.0%(-16.2)#102 |
| 5. | Smithville | 0.87% | 19.7%(-18.8)#5 | 17.0%(-16.1)#118 |
| 6. | Highland Village | 0.89% | 19.7%(-18.8)#6 | 17.0%(-16.1)#127 |
| 7. | Robinson | 0.89% | 19.7%(-18.8)#7 | 17.0%(-16.1)#130 |
| 8. | Palm Valley | 0.90% | 19.7%(-18.8)#8 | 17.0%(-16.1)#133 |
| 9. | Fair Oaks Ranch | 0.90% | 19.7%(-18.8)#9 | 17.0%(-16.1)#135 |
| 10. | Shady Hollow | 0.95% | 19.7%(-18.7)#10 | 17.0%(-16.0)#147 |
| 11. | Steiner Ranch | 1.0% | 19.7%(-18.7)#11 | 17.0%(-16.0)#171 |
| 12. | East Bernard | 1.0% | 19.7%(-18.7)#12 | 17.0%(-15.9)#180 |
| 13. | Bunker Hill Village | 1.0% | 19.7%(-18.6)#13 | 17.0%(-15.9)#181 |
| 14. | Shallowater | 1.1% | 19.7%(-18.6)#14 | 17.0%(-15.9)#187 |
| 15. | Paloma Creek South | 1.1% | 19.7%(-18.6)#15 | 17.0%(-15.9)#197 |
| 16. | Brushy Creek | 1.1% | 19.7%(-18.6)#16 | 17.0%(-15.8)#211 |
| 17. | Iowa Colony | 1.2% | 19.7%(-18.5)#17 | 17.0%(-15.8)#222 |
| 18. | Bellaire | 1.2% | 19.7%(-18.5)#18 | 17.0%(-15.8)#240 |
| 19. | Corinth | 1.3% | 19.7%(-18.4)#19 | 17.0%(-15.7)#246 |
| 20. | Hilshire Village | 1.3% | 19.7%(-18.4)#20 | 17.0%(-15.7)#256 |
| 21. | Fulshear | 1.3% | 19.7%(-18.4)#21 | 17.0%(-15.7)#260 |
| 22. | Cross Roads | 1.3% | 19.7%(-18.4)#22 | 17.0%(-15.7)#286 |
| 23. | Southlake | 1.5% | 19.7%(-18.2)#23 | 17.0%(-15.4)#363 |
| 24. | Honey Grove | 1.6% | 19.7%(-18.1)#24 | 17.0%(-15.4)#375 |
| 25. | Potosi | 1.6% | 19.7%(-18.1)#25 | 17.0%(-15.4)#380 |
| 26. | West University Place | 1.6% | 19.7%(-18.1)#26 | 17.0%(-15.4)#385 |
| 27. | Edom | 1.6% | 19.7%(-18.1)#27 | 17.0%(-15.4)#389 |
| 28. | Denver City | 1.6% | 19.7%(-18.1)#28 | 17.0%(-15.4)#405 |
| 29. | Briarcliff | 1.7% | 19.7%(-18.0)#29 | 17.0%(-15.3)#422 |
| 30. | Lackland Afb | 1.7% | 19.7%(-18.0)#30 | 17.0%(-15.2)#459 |
| 31. | Grandview | 1.8% | 19.7%(-17.9)#31 | 17.0%(-15.2)#474 |
| 32. | Louise | 1.8% | 19.7%(-17.9)#32 | 17.0%(-15.2)#479 |
| 33. | Richwood | 1.9% | 19.7%(-17.8)#33 | 17.0%(-15.0)#559 |
| 34. | Manvel | 2.0% | 19.7%(-17.7)#34 | 17.0%(-15.0)#582 |
| 35. | Frisco | 2.0% | 19.7%(-17.7)#35 | 17.0%(-15.0)#588 |
| 36. | Magnolia | 2.0% | 19.7%(-17.7)#36 | 17.0%(-14.9)#603 |
| 37. | Prosper | 2.1% | 19.7%(-17.6)#37 | 17.0%(-14.9)#652 |
| 38. | Pottsboro | 2.1% | 19.7%(-17.6)#38 | 17.0%(-14.9)#656 |
| 39. | China Grove | 2.1% | 19.7%(-17.6)#39 | 17.0%(-14.8)#668 |
| 40. | Lakeway | 2.1% | 19.7%(-17.6)#40 | 17.0%(-14.8)#674 |
| 41. | Liberty Hill | 2.2% | 19.7%(-17.5)#41 | 17.0%(-14.7)#726 |
| 42. | Anna | 2.3% | 19.7%(-17.4)#42 | 17.0%(-14.7)#750 |
| 43. | University Park | 2.3% | 19.7%(-17.4)#43 | 17.0%(-14.7)#767 |
| 44. | Melissa | 2.3% | 19.7%(-17.4)#44 | 17.0%(-14.7)#775 |
| 45. | Poth | 2.4% | 19.7%(-17.3)#45 | 17.0%(-14.6)#808 |
| 46. | Paradise | 2.4% | 19.7%(-17.3)#46 | 17.0%(-14.5)#847 |
| 47. | Bogata | 2.5% | 19.7%(-17.2)#47 | 17.0%(-14.5)#858 |
| 48. | Krum | 2.5% | 19.7%(-17.2)#48 | 17.0%(-14.5)#861 |
| 49. | Sudan | 2.5% | 19.7%(-17.2)#49 | 17.0%(-14.5)#872 |
| 50. | Glen Rose | 2.5% | 19.7%(-17.2)#50 | 17.0%(-14.4)#902 |
| 51. | Bellville | 2.6% | 19.7%(-17.1)#51 | 17.0%(-14.4)#912 |
| 52. | Helotes | 2.6% | 19.7%(-17.1)#52 | 17.0%(-14.4)#916 |
| 53. | Rockwall | 2.6% | 19.7%(-17.1)#53 | 17.0%(-14.4)#934 |
| 54. | Lakeside City | 2.6% | 19.7%(-17.0)#54 | 17.0%(-14.3)#960 |
| 55. | New Braunfels | 2.7% | 19.7%(-17.0)#55 | 17.0%(-14.3)#966 |
| 56. | Haskell | 2.7% | 19.7%(-17.0)#56 | 17.0%(-14.3)#971 |
| 57. | Decatur | 2.7% | 19.7%(-17.0)#57 | 17.0%(-14.3)#988 |
| 58. | New Hope | 2.7% | 19.7%(-17.0)#58 | 17.0%(-14.3)#992 |
| 59. | Saginaw | 2.8% | 19.7%(-16.9)#59 | 17.0%(-14.2)#1,030 |
| 60. | Gunter | 2.8% | 19.7%(-16.9)#60 | 17.0%(-14.2)#1,036 |
| 61. | Burkburnett | 2.8% | 19.7%(-16.9)#61 | 17.0%(-14.2)#1,051 |
| 62. | Colleyville | 2.8% | 19.7%(-16.9)#62 | 17.0%(-14.2)#1,065 |
| 63. | Tool | 2.9% | 19.7%(-16.8)#63 | 17.0%(-14.1)#1,125 |
| 64. | Easton | 2.9% | 19.7%(-16.8)#64 | 17.0%(-14.0)#1,146 |
| 65. | Hawkins | 3.0% | 19.7%(-16.7)#65 | 17.0%(-14.0)#1,182 |
| 66. | Shoreacres | 3.0% | 19.7%(-16.7)#66 | 17.0%(-13.9)#1,191 |
| 67. | Hollywood Park | 3.1% | 19.7%(-16.6)#67 | 17.0%(-13.9)#1,216 |
| 68. | Taft Southwest | 3.1% | 19.7%(-16.6)#68 | 17.0%(-13.9)#1,232 |
| 69. | West | 3.2% | 19.7%(-16.5)#69 | 17.0%(-13.8)#1,282 |
| 70. | Willis | 3.2% | 19.7%(-16.5)#70 | 17.0%(-13.7)#1,324 |
| 71. | Friendswood | 3.3% | 19.7%(-16.4)#71 | 17.0%(-13.7)#1,340 |
| 72. | Pflugerville | 3.3% | 19.7%(-16.4)#72 | 17.0%(-13.7)#1,357 |
| 73. | Berryville | 3.3% | 19.7%(-16.4)#73 | 17.0%(-13.6)#1,384 |
| 74. | Bronte | 3.3% | 19.7%(-16.4)#74 | 17.0%(-13.6)#1,386 |
| 75. | Dodd City | 3.3% | 19.7%(-16.4)#75 | 17.0%(-13.6)#1,392 |
| 76. | Sanger | 3.4% | 19.7%(-16.3)#76 | 17.0%(-13.6)#1,435 |
| 77. | Seymour | 3.5% | 19.7%(-16.2)#77 | 17.0%(-13.5)#1,492 |
| 78. | Hamlin | 3.6% | 19.7%(-16.1)#78 | 17.0%(-13.4)#1,523 |
| 79. | Alvord | 3.6% | 19.7%(-16.1)#79 | 17.0%(-13.4)#1,542 |
| 80. | Keller | 3.6% | 19.7%(-16.1)#80 | 17.0%(-13.4)#1,547 |
| 81. | Danbury | 3.6% | 19.7%(-16.1)#81 | 17.0%(-13.4)#1,553 |
| 82. | Blooming Grove | 3.6% | 19.7%(-16.1)#82 | 17.0%(-13.3)#1,573 |
| 83. | Murphy | 3.7% | 19.7%(-16.0)#83 | 17.0%(-13.3)#1,581 |
| 84. | Texhoma | 3.7% | 19.7%(-16.0)#84 | 17.0%(-13.3)#1,604 |
| 85. | Cibolo | 3.8% | 19.7%(-15.9)#85 | 17.0%(-13.2)#1,656 |
| 86. | Vidor | 3.8% | 19.7%(-15.9)#86 | 17.0%(-13.2)#1,663 |
| 87. | Lago Vista | 3.8% | 19.7%(-15.9)#87 | 17.0%(-13.2)#1,668 |
| 88. | Rosita | 3.8% | 19.7%(-15.8)#88 | 17.0%(-13.1)#1,691 |
| 89. | Hillcrest | 3.8% | 19.7%(-15.8)#89 | 17.0%(-13.1)#1,693 |
| 90. | Italy | 3.9% | 19.7%(-15.8)#90 | 17.0%(-13.1)#1,709 |
| 91. | Belterra | 3.9% | 19.7%(-15.8)#91 | 17.0%(-13.1)#1,718 |
| 92. | Big Lake | 3.9% | 19.7%(-15.8)#92 | 17.0%(-13.0)#1,753 |
| 93. | League City | 4.0% | 19.7%(-15.7)#93 | 17.0%(-13.0)#1,766 |
| 94. | Manor | 4.0% | 19.7%(-15.7)#94 | 17.0%(-13.0)#1,805 |
| 95. | Sugar Land | 4.0% | 19.7%(-15.7)#95 | 17.0%(-12.9)#1,812 |
| 96. | Lakeside Town Tarrant County | 4.1% | 19.7%(-15.6)#96 | 17.0%(-12.9)#1,861 |
| 97. | Georgetown | 4.2% | 19.7%(-15.5)#97 | 17.0%(-12.8)#1,886 |
| 98. | Thrall | 4.2% | 19.7%(-15.5)#98 | 17.0%(-12.8)#1,897 |
| 99. | Frost | 4.2% | 19.7%(-15.5)#99 | 17.0%(-12.8)#1,898 |
| 100. | Marlin | 4.2% | 19.7%(-15.5)#100 | 17.0%(-12.8)#1,927 |
Common Questions
What are the Top 10 Cities with the Lowest Child Poverty Level Among Girls Under the Age of 16 in Texas?
Top 10 Cities with the Lowest Child Poverty Level Among Girls Under the Age of 16 in Texas are:
#1
0.32%
#2
0.68%
#3
0.68%
#4
0.81%
#5
0.87%
#6
0.89%
#7
0.89%
#8
0.90%
#9
0.90%
#10
0.95%
What city has the Lowest Child Poverty Level Among Girls Under the Age of 16 in Texas?
Sachse has the Lowest Child Poverty Level Among Girls Under the Age of 16 in Texas with 0.32%.
What is the Poverty Level Among Girls Under the Age of 16 in the State of Texas?
Poverty Level Among Girls Under the Age of 16 in Texas is 19.7%.
What is the Poverty Level Among Girls Under the Age of 16 in the United States?
Poverty Level Among Girls Under the Age of 16 in the United States is 17.0%.