Cities with the Lowest Child Poverty Level Among Girls Under the Age of 16 in Alaska
RELATED REPORTS & OPTIONS
Lowest Poverty | Girls 0-16
Alaska
Compare Cities
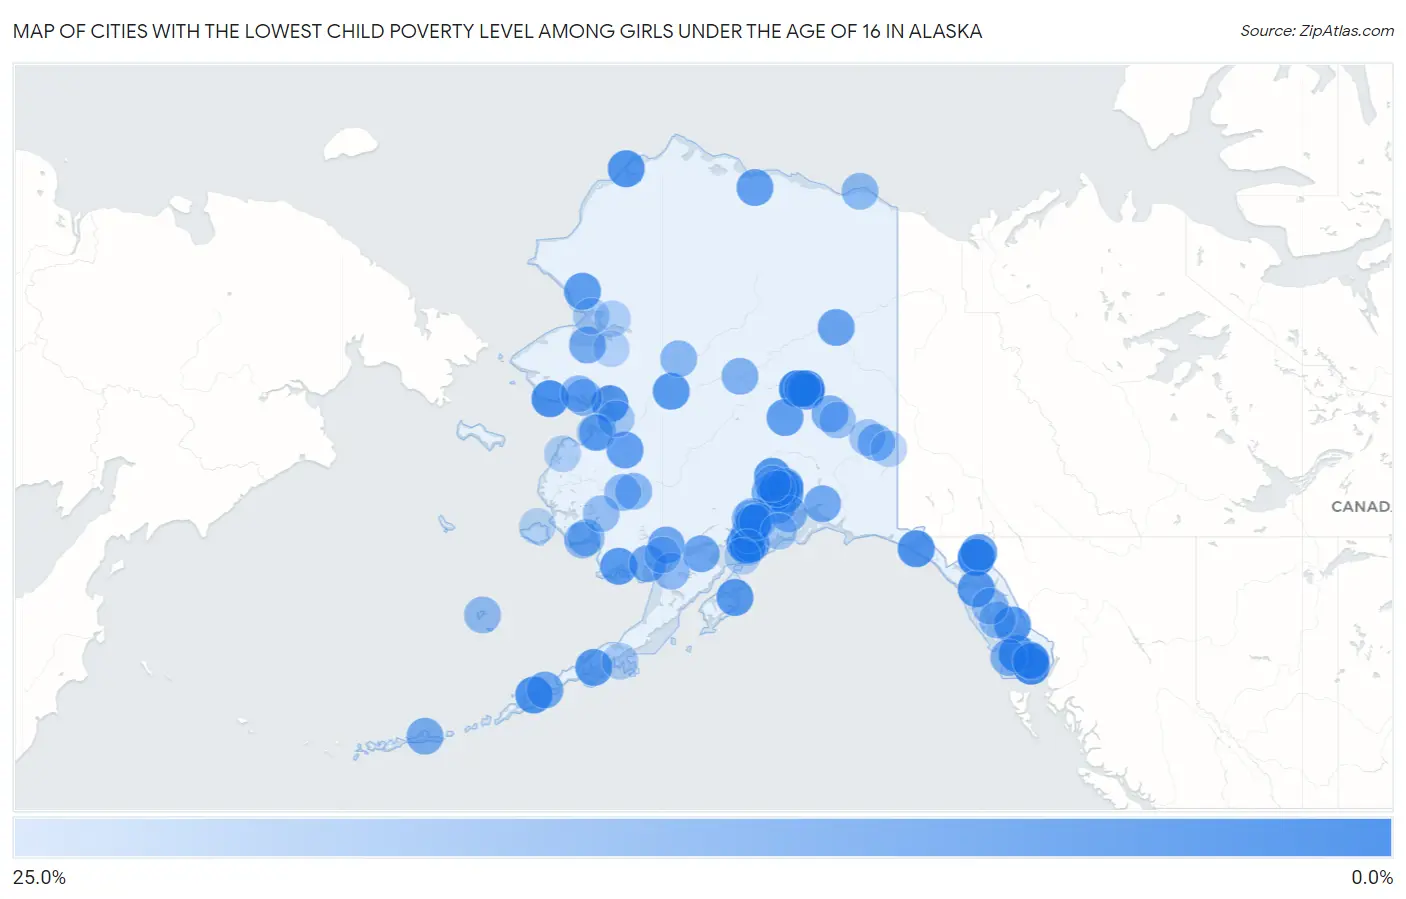
Map of Cities with the Lowest Child Poverty Level Among Girls Under the Age of 16 in Alaska
25.0%
0.0%
Cities with the Lowest Child Poverty Level Among Girls Under the Age of 16 in Alaska
| City | Child Poverty (Girls) | vs State | vs National | |
| 1. | Haines | 0.44% | 13.7%(-13.2)#1 | 17.0%(-16.5)#30 |
| 2. | Chena Ridge | 0.83% | 13.7%(-12.8)#2 | 17.0%(-16.1)#105 |
| 3. | Badger | 2.0% | 13.7%(-11.7)#3 | 17.0%(-15.0)#580 |
| 4. | Gateway | 2.5% | 13.7%(-11.1)#4 | 17.0%(-14.5)#901 |
| 5. | Metlakatla | 2.9% | 13.7%(-10.7)#5 | 17.0%(-14.0)#1,137 |
| 6. | Fishhook | 3.2% | 13.7%(-10.4)#6 | 17.0%(-13.8)#1,292 |
| 7. | Kalifornsky | 3.2% | 13.7%(-10.4)#7 | 17.0%(-13.8)#1,298 |
| 8. | Thorne Bay | 3.8% | 13.7%(-9.81)#8 | 17.0%(-13.1)#1,698 |
| 9. | Nome | 4.0% | 13.7%(-9.66)#9 | 17.0%(-13.0)#1,782 |
| 10. | Anchor Point | 4.1% | 13.7%(-9.51)#10 | 17.0%(-12.8)#1,878 |
| 11. | Unalaska | 4.3% | 13.7%(-9.40)#11 | 17.0%(-12.7)#1,957 |
| 12. | Mill Bay | 4.6% | 13.7%(-9.09)#12 | 17.0%(-12.4)#2,168 |
| 13. | Yakutat | 4.8% | 13.7%(-8.89)#13 | 17.0%(-12.2)#2,288 |
| 14. | Juneau City And Borough | 5.0% | 13.7%(-8.64)#14 | 17.0%(-12.0)#2,472 |
| 15. | Wainwright | 5.3% | 13.7%(-8.32)#15 | 17.0%(-11.6)#2,651 |
| 16. | Knik River | 5.5% | 13.7%(-8.18)#16 | 17.0%(-11.5)#2,718 |
| 17. | Butte | 6.2% | 13.7%(-7.44)#17 | 17.0%(-10.8)#3,142 |
| 18. | Shaktoolik | 6.2% | 13.7%(-7.41)#18 | 17.0%(-10.7)#3,181 |
| 19. | Diamond Ridge | 6.5% | 13.7%(-7.12)#19 | 17.0%(-10.4)#3,330 |
| 20. | Susitna North | 6.6% | 13.7%(-7.10)#20 | 17.0%(-10.4)#3,340 |
| 21. | Galena | 6.7% | 13.7%(-6.99)#21 | 17.0%(-10.3)#3,395 |
| 22. | King Cove | 6.8% | 13.7%(-6.88)#22 | 17.0%(-10.2)#3,490 |
| 23. | Lazy Mountain | 6.9% | 13.7%(-6.78)#23 | 17.0%(-10.1)#3,539 |
| 24. | Petersburg | 6.9% | 13.7%(-6.71)#24 | 17.0%(-10.0)#3,586 |
| 25. | Buffalo Soapstone | 7.0% | 13.7%(-6.68)#25 | 17.0%(-10.00)#3,606 |
| 26. | Togiak | 7.0% | 13.7%(-6.68)#26 | 17.0%(-10.00)#3,608 |
| 27. | Farm Loop | 7.0% | 13.7%(-6.67)#27 | 17.0%(-9.99)#3,615 |
| 28. | Hoonah | 7.0% | 13.7%(-6.64)#28 | 17.0%(-9.96)#3,629 |
| 29. | Kodiak | 7.0% | 13.7%(-6.61)#29 | 17.0%(-9.93)#3,644 |
| 30. | Fritz Creek | 7.6% | 13.7%(-6.05)#30 | 17.0%(-9.37)#3,962 |
| 31. | Noatak | 7.8% | 13.7%(-5.86)#31 | 17.0%(-9.18)#4,091 |
| 32. | North Lakes | 8.1% | 13.7%(-5.53)#32 | 17.0%(-8.85)#4,286 |
| 33. | Healy | 8.3% | 13.7%(-5.32)#33 | 17.0%(-8.64)#4,388 |
| 34. | Grayling | 8.7% | 13.7%(-4.96)#34 | 17.0%(-8.28)#4,597 |
| 35. | North Pole | 8.8% | 13.7%(-4.83)#35 | 17.0%(-8.15)#4,646 |
| 36. | Nuiqsut | 9.0% | 13.7%(-4.64)#36 | 17.0%(-7.96)#4,731 |
| 37. | Fort Yukon | 9.7% | 13.7%(-3.93)#37 | 17.0%(-7.25)#5,124 |
| 38. | Wasilla | 10.2% | 13.7%(-3.44)#38 | 17.0%(-6.77)#5,372 |
| 39. | Skagway | 10.6% | 13.7%(-3.08)#39 | 17.0%(-6.40)#5,582 |
| 40. | Kokhanok | 10.7% | 13.7%(-2.94)#40 | 17.0%(-6.26)#5,680 |
| 41. | Dillingham | 11.2% | 13.7%(-2.50)#41 | 17.0%(-5.82)#5,882 |
| 42. | Palmer | 11.2% | 13.7%(-2.45)#42 | 17.0%(-5.77)#5,906 |
| 43. | Ketchikan | 11.3% | 13.7%(-2.34)#43 | 17.0%(-5.66)#5,944 |
| 44. | Koliganek | 11.4% | 13.7%(-2.23)#44 | 17.0%(-5.55)#6,006 |
| 45. | Valdez | 11.7% | 13.7%(-1.93)#45 | 17.0%(-5.25)#6,133 |
| 46. | Akutan | 11.8% | 13.7%(-1.89)#46 | 17.0%(-5.21)#6,144 |
| 47. | Big Lake | 11.9% | 13.7%(-1.77)#47 | 17.0%(-5.09)#6,215 |
| 48. | Fairbanks | 12.3% | 13.7%(-1.31)#48 | 17.0%(-4.63)#6,434 |
| 49. | Meadow Lakes | 12.4% | 13.7%(-1.21)#49 | 17.0%(-4.53)#6,477 |
| 50. | St Michael | 12.5% | 13.7%(-1.16)#50 | 17.0%(-4.48)#6,533 |
| 51. | Atka | 12.5% | 13.7%(-1.16)#51 | 17.0%(-4.48)#6,560 |
| 52. | Anchorage | 12.8% | 13.7%(-0.870)#52 | 17.0%(-4.19)#6,678 |
| 53. | Deering | 12.8% | 13.7%(-0.835)#53 | 17.0%(-4.16)#6,695 |
| 54. | Delta Junction | 13.2% | 13.7%(-0.477)#54 | 17.0%(-3.80)#6,846 |
| 55. | Knik Fairview | 13.3% | 13.7%(-0.397)#55 | 17.0%(-3.72)#6,887 |
| 56. | Sitka City And Borough | 13.9% | 13.7%(+0.263)#56 | 17.0%(-3.06)#7,204 |
| 57. | Craig | 13.9% | 13.7%(+0.269)#57 | 17.0%(-3.05)#7,210 |
| 58. | Saxman | 14.3% | 13.7%(+0.630)#58 | 17.0%(-2.69)#7,387 |
| 59. | Tanana | 14.3% | 13.7%(+0.630)#59 | 17.0%(-2.69)#7,399 |
| 60. | Tetlin | 14.3% | 13.7%(+0.630)#60 | 17.0%(-2.69)#7,402 |
| 61. | Golovin | 14.3% | 13.7%(+0.630)#61 | 17.0%(-2.69)#7,405 |
| 62. | Sutton Alpine | 15.0% | 13.7%(+1.34)#62 | 17.0%(-1.98)#7,696 |
| 63. | Whittier | 15.0% | 13.7%(+1.34)#63 | 17.0%(-1.98)#7,703 |
| 64. | Ninilchik | 15.1% | 13.7%(+1.44)#64 | 17.0%(-1.88)#7,752 |
| 65. | Utqiagvik | 15.3% | 13.7%(+1.60)#65 | 17.0%(-1.72)#7,833 |
| 66. | Aniak | 15.9% | 13.7%(+2.25)#66 | 17.0%(-1.07)#8,143 |
| 67. | Huslia | 16.0% | 13.7%(+2.34)#67 | 17.0%(-0.976)#8,187 |
| 68. | Kake | 16.1% | 13.7%(+2.42)#68 | 17.0%(-0.905)#8,211 |
| 69. | Salamatof | 16.3% | 13.7%(+2.62)#69 | 17.0%(-0.697)#8,308 |
| 70. | South Lakes | 16.5% | 13.7%(+2.80)#70 | 17.0%(-0.525)#8,371 |
| 71. | Kongiganak | 16.7% | 13.7%(+3.01)#71 | 17.0%(-0.309)#8,464 |
| 72. | Kaktovik | 16.7% | 13.7%(+3.01)#72 | 17.0%(-0.309)#8,484 |
| 73. | Naknek | 17.1% | 13.7%(+3.49)#73 | 17.0%(+0.167)#8,688 |
| 74. | White Mountain | 17.2% | 13.7%(+3.59)#74 | 17.0%(+0.265)#8,731 |
| 75. | Kwigillingok | 17.3% | 13.7%(+3.62)#75 | 17.0%(+0.297)#8,744 |
| 76. | Upper Kalskag | 17.3% | 13.7%(+3.65)#76 | 17.0%(+0.332)#8,761 |
| 77. | St Paul | 17.4% | 13.7%(+3.74)#77 | 17.0%(+0.415)#8,794 |
| 78. | Tanaina | 17.8% | 13.7%(+4.16)#78 | 17.0%(+0.841)#8,956 |
| 79. | Angoon | 18.0% | 13.7%(+4.34)#79 | 17.0%(+1.02)#9,025 |
| 80. | Bethel | 18.5% | 13.7%(+4.80)#80 | 17.0%(+1.48)#9,218 |
| 81. | Deltana | 19.0% | 13.7%(+5.39)#81 | 17.0%(+2.07)#9,433 |
| 82. | Nikiski | 19.3% | 13.7%(+5.63)#82 | 17.0%(+2.31)#9,536 |
| 83. | Soldotna | 19.9% | 13.7%(+6.20)#83 | 17.0%(+2.88)#9,735 |
| 84. | Unalakleet | 20.0% | 13.7%(+6.34)#84 | 17.0%(+3.02)#9,788 |
| 85. | Ekwok | 20.0% | 13.7%(+6.34)#85 | 17.0%(+3.02)#9,864 |
| 86. | Sterling | 20.4% | 13.7%(+6.76)#86 | 17.0%(+3.44)#9,964 |
| 87. | Tok | 21.1% | 13.7%(+7.40)#87 | 17.0%(+4.08)#10,189 |
| 88. | Bear Creek | 21.1% | 13.7%(+7.40)#88 | 17.0%(+4.08)#10,190 |
| 89. | Stebbins | 21.6% | 13.7%(+7.91)#89 | 17.0%(+4.59)#10,395 |
| 90. | Willow | 21.7% | 13.7%(+8.02)#90 | 17.0%(+4.70)#10,432 |
| 91. | Kotzebue | 21.8% | 13.7%(+8.19)#91 | 17.0%(+4.87)#10,493 |
| 92. | Sand Point | 22.0% | 13.7%(+8.30)#92 | 17.0%(+4.98)#10,532 |
| 93. | Homer | 22.6% | 13.7%(+8.99)#93 | 17.0%(+5.67)#10,769 |
| 94. | Emmonak | 22.9% | 13.7%(+9.23)#94 | 17.0%(+5.91)#10,853 |
| 95. | Northway | 23.2% | 13.7%(+9.53)#95 | 17.0%(+6.21)#10,952 |
| 96. | Noorvik | 23.4% | 13.7%(+9.71)#96 | 17.0%(+6.39)#11,020 |
| 97. | Buckland | 23.8% | 13.7%(+10.2)#97 | 17.0%(+6.83)#11,166 |
| 98. | Mekoryuk | 23.9% | 13.7%(+10.3)#98 | 17.0%(+6.94)#11,200 |
| 99. | Nanwalek | 24.1% | 13.7%(+10.5)#99 | 17.0%(+7.16)#11,277 |
| 100. | Wrangell City And Borough | 24.5% | 13.7%(+10.8)#100 | 17.0%(+7.52)#11,364 |
Common Questions
What are the Top 10 Cities with the Lowest Child Poverty Level Among Girls Under the Age of 16 in Alaska?
Top 10 Cities with the Lowest Child Poverty Level Among Girls Under the Age of 16 in Alaska are:
#1
0.44%
#2
0.83%
#3
2.0%
#4
2.5%
#5
2.9%
#6
3.2%
#7
3.2%
#8
3.8%
#9
4.0%
#10
4.1%
What city has the Lowest Child Poverty Level Among Girls Under the Age of 16 in Alaska?
Haines has the Lowest Child Poverty Level Among Girls Under the Age of 16 in Alaska with 0.44%.
What is the Poverty Level Among Girls Under the Age of 16 in the State of Alaska?
Poverty Level Among Girls Under the Age of 16 in Alaska is 13.7%.
What is the Poverty Level Among Girls Under the Age of 16 in the United States?
Poverty Level Among Girls Under the Age of 16 in the United States is 17.0%.