Cities with the Lowest Child Poverty Level Among Girls Under the Age of 16 in Louisiana
RELATED REPORTS & OPTIONS
Lowest Poverty | Girls 0-16
Louisiana
Compare Cities
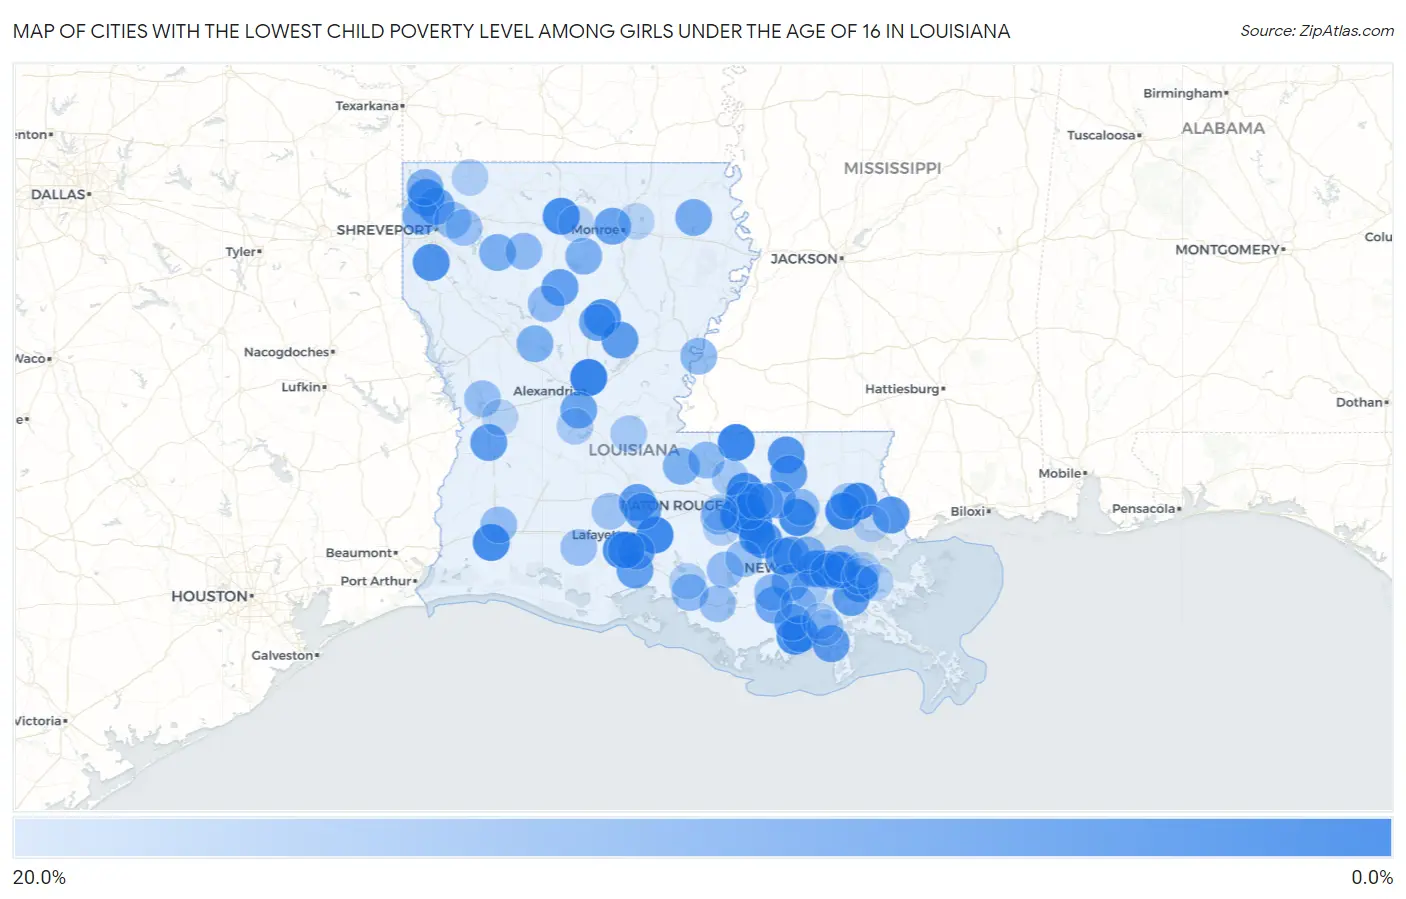
Map of Cities with the Lowest Child Poverty Level Among Girls Under the Age of 16 in Louisiana
20.0%
0.0%
Cities with the Lowest Child Poverty Level Among Girls Under the Age of 16 in Louisiana
| City | Child Poverty (Girls) | vs State | vs National | |
| 1. | Oak Hills Place | 0.96% | 26.1%(-25.2)#1 | 17.0%(-16.0)#148 |
| 2. | Ball | 0.99% | 26.1%(-25.1)#2 | 17.0%(-16.0)#165 |
| 3. | Wilson | 1.5% | 26.1%(-24.6)#3 | 17.0%(-15.4)#364 |
| 4. | Abita Springs | 1.8% | 26.1%(-24.4)#4 | 17.0%(-15.2)#481 |
| 5. | Prairieville | 2.1% | 26.1%(-24.1)#5 | 17.0%(-14.9)#635 |
| 6. | Parks | 2.2% | 26.1%(-24.0)#6 | 17.0%(-14.8)#687 |
| 7. | Madisonville | 2.2% | 26.1%(-24.0)#7 | 17.0%(-14.8)#698 |
| 8. | Vienna | 2.8% | 26.1%(-23.4)#8 | 17.0%(-14.2)#1,041 |
| 9. | Central | 2.9% | 26.1%(-23.3)#9 | 17.0%(-14.1)#1,104 |
| 10. | Prien | 3.1% | 26.1%(-23.1)#10 | 17.0%(-13.9)#1,210 |
| 11. | Killian | 3.2% | 26.1%(-22.9)#11 | 17.0%(-13.8)#1,302 |
| 12. | River Ridge | 3.2% | 26.1%(-22.9)#12 | 17.0%(-13.7)#1,325 |
| 13. | Belle Chasse | 3.4% | 26.1%(-22.7)#13 | 17.0%(-13.5)#1,450 |
| 14. | Maurice | 3.6% | 26.1%(-22.6)#14 | 17.0%(-13.4)#1,540 |
| 15. | Chauvin | 3.8% | 26.1%(-22.4)#15 | 17.0%(-13.2)#1,634 |
| 16. | Old Jefferson | 3.8% | 26.1%(-22.4)#16 | 17.0%(-13.2)#1,649 |
| 17. | Stonewall | 4.1% | 26.1%(-22.0)#17 | 17.0%(-12.9)#1,860 |
| 18. | Sorrento | 4.3% | 26.1%(-21.8)#18 | 17.0%(-12.6)#2,018 |
| 19. | Urania | 4.3% | 26.1%(-21.8)#19 | 17.0%(-12.6)#2,020 |
| 20. | Gonzales | 4.6% | 26.1%(-21.5)#20 | 17.0%(-12.3)#2,208 |
| 21. | Greensburg | 4.9% | 26.1%(-21.2)#21 | 17.0%(-12.1)#2,391 |
| 22. | Pearl River | 5.3% | 26.1%(-20.8)#22 | 17.0%(-11.7)#2,640 |
| 23. | Belcher | 5.4% | 26.1%(-20.7)#23 | 17.0%(-11.6)#2,693 |
| 24. | Gramercy | 5.9% | 26.1%(-20.2)#24 | 17.0%(-11.0)#2,997 |
| 25. | Montegut | 6.0% | 26.1%(-20.2)#25 | 17.0%(-11.0)#3,009 |
| 26. | Jena | 6.2% | 26.1%(-20.0)#26 | 17.0%(-10.8)#3,122 |
| 27. | Rosepine | 6.2% | 26.1%(-19.9)#27 | 17.0%(-10.7)#3,160 |
| 28. | Montpelier | 6.5% | 26.1%(-19.7)#28 | 17.0%(-10.5)#3,268 |
| 29. | Golden Meadow | 6.5% | 26.1%(-19.7)#29 | 17.0%(-10.5)#3,288 |
| 30. | Leonville | 6.6% | 26.1%(-19.5)#30 | 17.0%(-10.4)#3,367 |
| 31. | Monticello | 6.8% | 26.1%(-19.4)#31 | 17.0%(-10.2)#3,478 |
| 32. | Jean Lafitte | 6.8% | 26.1%(-19.3)#32 | 17.0%(-10.2)#3,498 |
| 33. | Dodson | 6.9% | 26.1%(-19.2)#33 | 17.0%(-10.1)#3,565 |
| 34. | Arnaudville | 7.0% | 26.1%(-19.2)#34 | 17.0%(-10.00)#3,598 |
| 35. | Delcambre | 7.0% | 26.1%(-19.1)#35 | 17.0%(-9.98)#3,617 |
| 36. | Youngsville | 7.0% | 26.1%(-19.1)#36 | 17.0%(-9.96)#3,634 |
| 37. | Destrehan | 7.5% | 26.1%(-18.7)#37 | 17.0%(-9.50)#3,907 |
| 38. | Milton | 7.6% | 26.1%(-18.6)#38 | 17.0%(-9.42)#3,938 |
| 39. | Claiborne | 7.6% | 26.1%(-18.5)#39 | 17.0%(-9.35)#3,975 |
| 40. | Garyville | 8.0% | 26.1%(-18.1)#40 | 17.0%(-8.98)#4,192 |
| 41. | Woodworth | 8.2% | 26.1%(-18.0)#41 | 17.0%(-8.81)#4,313 |
| 42. | Tullos | 8.3% | 26.1%(-17.8)#42 | 17.0%(-8.64)#4,405 |
| 43. | Benton | 8.4% | 26.1%(-17.7)#43 | 17.0%(-8.54)#4,455 |
| 44. | Gray | 8.6% | 26.1%(-17.5)#44 | 17.0%(-8.35)#4,551 |
| 45. | Bourg | 8.6% | 26.1%(-17.5)#45 | 17.0%(-8.34)#4,555 |
| 46. | Kraemer | 8.8% | 26.1%(-17.4)#46 | 17.0%(-8.20)#4,624 |
| 47. | Livingston | 9.0% | 26.1%(-17.1)#47 | 17.0%(-7.93)#4,742 |
| 48. | Blanchard | 9.1% | 26.1%(-17.0)#48 | 17.0%(-7.84)#4,806 |
| 49. | Epps | 9.5% | 26.1%(-16.6)#49 | 17.0%(-7.45)#5,013 |
| 50. | St Rose | 9.7% | 26.1%(-16.4)#50 | 17.0%(-7.24)#5,128 |
| 51. | Jamestown | 10.0% | 26.1%(-16.1)#51 | 17.0%(-6.98)#5,276 |
| 52. | Hahnville | 10.2% | 26.1%(-15.9)#52 | 17.0%(-6.73)#5,386 |
| 53. | Morganza | 10.3% | 26.1%(-15.8)#53 | 17.0%(-6.63)#5,445 |
| 54. | Montgomery | 10.4% | 26.1%(-15.8)#54 | 17.0%(-6.59)#5,474 |
| 55. | Chatham | 10.5% | 26.1%(-15.6)#55 | 17.0%(-6.45)#5,551 |
| 56. | Shenandoah | 10.6% | 26.1%(-15.5)#56 | 17.0%(-6.34)#5,622 |
| 57. | Gilliam | 11.1% | 26.1%(-15.0)#57 | 17.0%(-5.86)#5,867 |
| 58. | Laplace | 11.5% | 26.1%(-14.6)#58 | 17.0%(-5.45)#6,055 |
| 59. | Vidalia | 12.1% | 26.1%(-14.1)#59 | 17.0%(-4.92)#6,295 |
| 60. | Bayou Country Club | 12.1% | 26.1%(-14.1)#60 | 17.0%(-4.91)#6,300 |
| 61. | Springfield | 12.2% | 26.1%(-13.9)#61 | 17.0%(-4.78)#6,367 |
| 62. | St Francisville | 12.2% | 26.1%(-13.9)#62 | 17.0%(-4.73)#6,384 |
| 63. | Elmwood | 12.5% | 26.1%(-13.7)#63 | 17.0%(-4.50)#6,482 |
| 64. | Bienville | 12.5% | 26.1%(-13.6)#64 | 17.0%(-4.48)#6,549 |
| 65. | Franklin | 12.6% | 26.1%(-13.5)#65 | 17.0%(-4.33)#6,602 |
| 66. | Addis | 12.9% | 26.1%(-13.3)#66 | 17.0%(-4.12)#6,706 |
| 67. | Calvin | 12.9% | 26.1%(-13.2)#67 | 17.0%(-4.07)#6,733 |
| 68. | Walker | 13.3% | 26.1%(-12.9)#68 | 17.0%(-3.69)#6,898 |
| 69. | Pierre Part | 13.4% | 26.1%(-12.8)#69 | 17.0%(-3.59)#6,959 |
| 70. | Moss Bluff | 13.5% | 26.1%(-12.6)#70 | 17.0%(-3.43)#7,018 |
| 71. | Denham Springs | 13.6% | 26.1%(-12.6)#71 | 17.0%(-3.41)#7,027 |
| 72. | Red Chute | 13.6% | 26.1%(-12.6)#72 | 17.0%(-3.41)#7,029 |
| 73. | Anacoco | 13.7% | 26.1%(-12.5)#73 | 17.0%(-3.29)#7,102 |
| 74. | Bayou Vista | 13.9% | 26.1%(-12.2)#74 | 17.0%(-3.07)#7,198 |
| 75. | Morse | 14.0% | 26.1%(-12.2)#75 | 17.0%(-3.02)#7,228 |
| 76. | Haughton | 14.1% | 26.1%(-12.1)#76 | 17.0%(-2.92)#7,267 |
| 77. | Belle Rose | 14.3% | 26.1%(-11.9)#77 | 17.0%(-2.69)#7,345 |
| 78. | Church Point | 14.8% | 26.1%(-11.4)#78 | 17.0%(-2.20)#7,602 |
| 79. | Covington | 14.8% | 26.1%(-11.3)#79 | 17.0%(-2.18)#7,615 |
| 80. | Des Allemands | 15.1% | 26.1%(-11.1)#80 | 17.0%(-1.92)#7,725 |
| 81. | Ama | 15.3% | 26.1%(-10.9)#81 | 17.0%(-1.71)#7,835 |
| 82. | Mathews | 15.5% | 26.1%(-10.6)#82 | 17.0%(-1.44)#7,979 |
| 83. | Zachary | 15.6% | 26.1%(-10.5)#83 | 17.0%(-1.33)#8,027 |
| 84. | Larose | 15.6% | 26.1%(-10.5)#84 | 17.0%(-1.33)#8,030 |
| 85. | Metairie | 15.7% | 26.1%(-10.5)#85 | 17.0%(-1.30)#8,037 |
| 86. | Cottonport | 15.9% | 26.1%(-10.2)#86 | 17.0%(-1.07)#8,137 |
| 87. | Forest Hill | 16.2% | 26.1%(-9.96)#87 | 17.0%(-0.800)#8,262 |
| 88. | Terrytown | 16.7% | 26.1%(-9.43)#88 | 17.0%(-0.262)#8,515 |
| 89. | Plaquemine | 16.9% | 26.1%(-9.21)#89 | 17.0%(-0.048)#8,585 |
| 90. | Sarepta | 16.9% | 26.1%(-9.19)#90 | 17.0%(-0.027)#8,592 |
| 91. | Charenton | 17.0% | 26.1%(-9.12)#91 | 17.0%(+0.045)#8,620 |
| 92. | Cut Off | 17.1% | 26.1%(-9.09)#92 | 17.0%(+0.074)#8,643 |
| 93. | Arabi | 17.1% | 26.1%(-9.02)#93 | 17.0%(+0.149)#8,676 |
| 94. | Poydras | 17.1% | 26.1%(-9.00)#94 | 17.0%(+0.167)#8,682 |
| 95. | Swartz | 17.8% | 26.1%(-8.39)#95 | 17.0%(+0.775)#8,924 |
| 96. | Fort Polk North | 17.9% | 26.1%(-8.27)#96 | 17.0%(+0.896)#8,975 |
| 97. | Brusly | 17.9% | 26.1%(-8.25)#97 | 17.0%(+0.919)#8,981 |
| 98. | Lacombe | 17.9% | 26.1%(-8.22)#98 | 17.0%(+0.941)#8,989 |
| 99. | Choudrant | 17.9% | 26.1%(-8.21)#99 | 17.0%(+0.955)#8,995 |
| 100. | New Orleans Station | 17.9% | 26.1%(-8.20)#100 | 17.0%(+0.967)#8,998 |
Common Questions
What are the Top 10 Cities with the Lowest Child Poverty Level Among Girls Under the Age of 16 in Louisiana?
Top 10 Cities with the Lowest Child Poverty Level Among Girls Under the Age of 16 in Louisiana are:
#1
0.96%
#2
0.99%
#3
1.5%
#4
1.8%
#5
2.1%
#6
2.2%
#7
2.2%
#8
2.8%
#9
2.9%
#10
3.1%
What city has the Lowest Child Poverty Level Among Girls Under the Age of 16 in Louisiana?
Oak Hills Place has the Lowest Child Poverty Level Among Girls Under the Age of 16 in Louisiana with 0.96%.
What is the Poverty Level Among Girls Under the Age of 16 in the State of Louisiana?
Poverty Level Among Girls Under the Age of 16 in Louisiana is 26.1%.
What is the Poverty Level Among Girls Under the Age of 16 in the United States?
Poverty Level Among Girls Under the Age of 16 in the United States is 17.0%.