Cities with the Lowest Child Poverty Level Among Girls Under the Age of 16 in Georgia
RELATED REPORTS & OPTIONS
Lowest Poverty | Girls 0-16
Georgia
Compare Cities
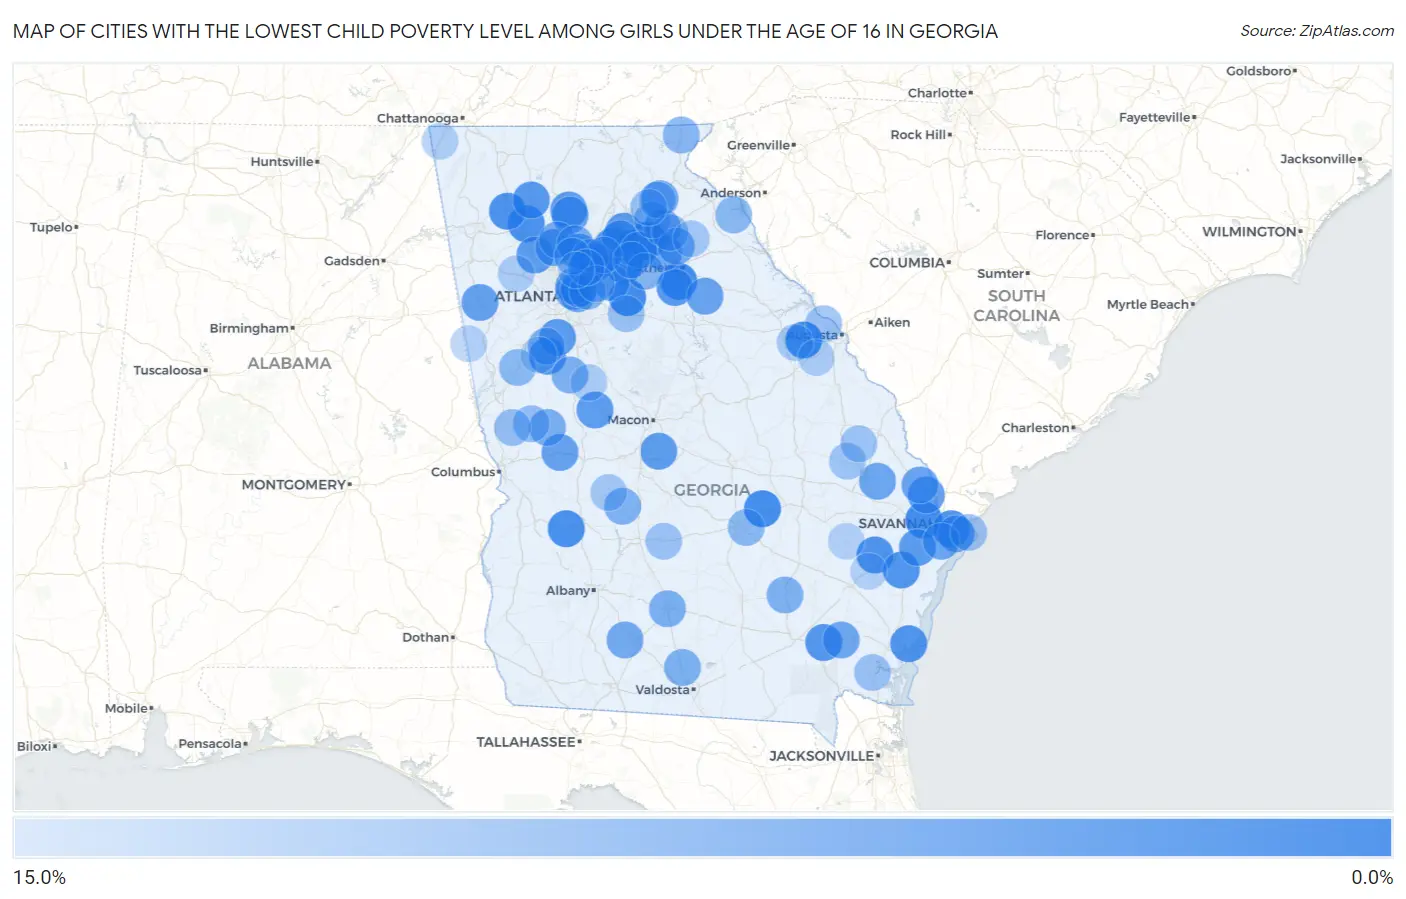
Map of Cities with the Lowest Child Poverty Level Among Girls Under the Age of 16 in Georgia
15.0%
0.0%
Cities with the Lowest Child Poverty Level Among Girls Under the Age of 16 in Georgia
| City | Child Poverty (Girls) | vs State | vs National | |
| 1. | Dacula | 0.37% | 19.3%(-18.9)#1 | 17.0%(-16.6)#21 |
| 2. | Berkeley Lake | 1.0% | 19.3%(-18.2)#2 | 17.0%(-15.9)#179 |
| 3. | Pendergrass | 1.1% | 19.3%(-18.1)#3 | 17.0%(-15.8)#213 |
| 4. | Walnut Grove | 1.1% | 19.3%(-18.1)#4 | 17.0%(-15.8)#216 |
| 5. | Harlem | 1.2% | 19.3%(-18.1)#5 | 17.0%(-15.8)#218 |
| 6. | Glenwood | 1.4% | 19.3%(-17.9)#6 | 17.0%(-15.6)#307 |
| 7. | Pooler | 1.4% | 19.3%(-17.9)#7 | 17.0%(-15.6)#313 |
| 8. | Watkinsville | 1.4% | 19.3%(-17.8)#8 | 17.0%(-15.5)#327 |
| 9. | Plains | 1.8% | 19.3%(-17.5)#9 | 17.0%(-15.2)#496 |
| 10. | White | 1.9% | 19.3%(-17.4)#10 | 17.0%(-15.1)#536 |
| 11. | Adairsville | 2.1% | 19.3%(-17.2)#11 | 17.0%(-14.9)#623 |
| 12. | Whitemarsh Island | 2.2% | 19.3%(-17.1)#12 | 17.0%(-14.8)#693 |
| 13. | Gumbranch | 2.3% | 19.3%(-17.0)#13 | 17.0%(-14.7)#742 |
| 14. | St Simons | 2.3% | 19.3%(-17.0)#14 | 17.0%(-14.7)#764 |
| 15. | Riceboro | 2.4% | 19.3%(-16.9)#15 | 17.0%(-14.6)#794 |
| 16. | Buford | 2.6% | 19.3%(-16.7)#16 | 17.0%(-14.4)#944 |
| 17. | Hoboken | 2.6% | 19.3%(-16.6)#17 | 17.0%(-14.3)#949 |
| 18. | Senoia | 2.7% | 19.3%(-16.5)#18 | 17.0%(-14.2)#1,012 |
| 19. | Fairmount | 2.8% | 19.3%(-16.5)#19 | 17.0%(-14.2)#1,061 |
| 20. | Alpharetta | 2.9% | 19.3%(-16.4)#20 | 17.0%(-14.1)#1,126 |
| 21. | Fairfield Plantation | 2.9% | 19.3%(-16.3)#21 | 17.0%(-14.0)#1,154 |
| 22. | Bishop | 3.0% | 19.3%(-16.2)#22 | 17.0%(-13.9)#1,197 |
| 23. | Richmond Hill | 3.1% | 19.3%(-16.1)#23 | 17.0%(-13.8)#1,259 |
| 24. | Acworth | 3.2% | 19.3%(-16.1)#24 | 17.0%(-13.8)#1,288 |
| 25. | Yatesville | 3.2% | 19.3%(-16.1)#25 | 17.0%(-13.8)#1,312 |
| 26. | Fayetteville | 3.3% | 19.3%(-16.0)#26 | 17.0%(-13.7)#1,345 |
| 27. | Robins Afb | 3.3% | 19.3%(-16.0)#27 | 17.0%(-13.7)#1,371 |
| 28. | Oakwood | 3.3% | 19.3%(-16.0)#28 | 17.0%(-13.7)#1,376 |
| 29. | Nelson | 3.4% | 19.3%(-15.9)#29 | 17.0%(-13.6)#1,406 |
| 30. | Rincon | 3.6% | 19.3%(-15.7)#30 | 17.0%(-13.4)#1,534 |
| 31. | Braselton | 3.7% | 19.3%(-15.6)#31 | 17.0%(-13.3)#1,593 |
| 32. | Woodstock | 3.8% | 19.3%(-15.5)#32 | 17.0%(-13.2)#1,637 |
| 33. | Wilmington Island | 3.8% | 19.3%(-15.4)#33 | 17.0%(-13.1)#1,688 |
| 34. | Bremen | 4.0% | 19.3%(-15.3)#34 | 17.0%(-13.0)#1,778 |
| 35. | Druid Hills | 4.0% | 19.3%(-15.3)#35 | 17.0%(-13.0)#1,779 |
| 36. | Junction City | 4.0% | 19.3%(-15.3)#36 | 17.0%(-13.0)#1,795 |
| 37. | Flowery Branch | 4.1% | 19.3%(-15.2)#37 | 17.0%(-12.9)#1,835 |
| 38. | Maxeys | 4.2% | 19.3%(-15.1)#38 | 17.0%(-12.8)#1,939 |
| 39. | Arcade | 4.2% | 19.3%(-15.0)#39 | 17.0%(-12.7)#1,945 |
| 40. | Ball Ground | 4.2% | 19.3%(-15.0)#40 | 17.0%(-12.7)#1,953 |
| 41. | Hoschton | 4.2% | 19.3%(-15.0)#41 | 17.0%(-12.7)#1,954 |
| 42. | Springfield | 4.3% | 19.3%(-14.9)#42 | 17.0%(-12.6)#2,013 |
| 43. | Montgomery | 4.5% | 19.3%(-14.8)#43 | 17.0%(-12.4)#2,138 |
| 44. | Brooklet | 4.5% | 19.3%(-14.7)#44 | 17.0%(-12.4)#2,146 |
| 45. | Nahunta | 4.7% | 19.3%(-14.6)#45 | 17.0%(-12.3)#2,248 |
| 46. | Alto | 4.7% | 19.3%(-14.5)#46 | 17.0%(-12.2)#2,273 |
| 47. | Maysville | 4.8% | 19.3%(-14.5)#47 | 17.0%(-12.2)#2,282 |
| 48. | Nicholson | 4.9% | 19.3%(-14.4)#48 | 17.0%(-12.1)#2,382 |
| 49. | Decatur | 4.9% | 19.3%(-14.3)#49 | 17.0%(-12.0)#2,414 |
| 50. | North Druid Hills | 5.0% | 19.3%(-14.3)#50 | 17.0%(-12.0)#2,465 |
| 51. | Funston | 5.1% | 19.3%(-14.2)#51 | 17.0%(-11.9)#2,494 |
| 52. | Snellville | 5.1% | 19.3%(-14.2)#52 | 17.0%(-11.9)#2,502 |
| 53. | Duluth | 5.2% | 19.3%(-14.0)#53 | 17.0%(-11.7)#2,600 |
| 54. | Holly Springs | 5.4% | 19.3%(-13.9)#54 | 17.0%(-11.6)#2,665 |
| 55. | Woodland | 5.6% | 19.3%(-13.7)#55 | 17.0%(-11.4)#2,768 |
| 56. | Unionville | 5.7% | 19.3%(-13.6)#56 | 17.0%(-11.3)#2,840 |
| 57. | Milton | 5.9% | 19.3%(-13.4)#57 | 17.0%(-11.1)#2,940 |
| 58. | Hahira | 5.9% | 19.3%(-13.4)#58 | 17.0%(-11.1)#2,979 |
| 59. | Williamson | 5.9% | 19.3%(-13.3)#59 | 17.0%(-11.0)#2,988 |
| 60. | Johns Creek | 5.9% | 19.3%(-13.3)#60 | 17.0%(-11.0)#2,989 |
| 61. | Byromville | 6.0% | 19.3%(-13.3)#61 | 17.0%(-11.0)#3,010 |
| 62. | Suwanee | 6.0% | 19.3%(-13.3)#62 | 17.0%(-11.0)#3,014 |
| 63. | Peachtree City | 6.1% | 19.3%(-13.2)#63 | 17.0%(-10.9)#3,046 |
| 64. | Alma | 6.1% | 19.3%(-13.2)#64 | 17.0%(-10.9)#3,052 |
| 65. | Bethlehem | 6.5% | 19.3%(-12.8)#65 | 17.0%(-10.5)#3,315 |
| 66. | North Decatur | 6.7% | 19.3%(-12.5)#66 | 17.0%(-10.2)#3,454 |
| 67. | Mountain City | 6.8% | 19.3%(-12.5)#67 | 17.0%(-10.2)#3,475 |
| 68. | Hartwell | 6.8% | 19.3%(-12.5)#68 | 17.0%(-10.2)#3,494 |
| 69. | Grantville | 6.9% | 19.3%(-12.4)#69 | 17.0%(-10.1)#3,548 |
| 70. | Pine Lake | 6.9% | 19.3%(-12.4)#70 | 17.0%(-10.1)#3,556 |
| 71. | Scotland | 6.9% | 19.3%(-12.4)#71 | 17.0%(-10.1)#3,564 |
| 72. | Roswell | 7.0% | 19.3%(-12.2)#72 | 17.0%(-9.93)#3,648 |
| 73. | Gillsville | 7.4% | 19.3%(-11.9)#73 | 17.0%(-9.57)#3,875 |
| 74. | Shiloh | 7.5% | 19.3%(-11.8)#74 | 17.0%(-9.48)#3,920 |
| 75. | Raoul | 7.6% | 19.3%(-11.7)#75 | 17.0%(-9.35)#3,972 |
| 76. | Hamilton | 7.7% | 19.3%(-11.6)#76 | 17.0%(-9.31)#3,997 |
| 77. | Mountain Park | 7.8% | 19.3%(-11.5)#77 | 17.0%(-9.22)#4,075 |
| 78. | Tybee Island | 8.0% | 19.3%(-11.3)#78 | 17.0%(-8.98)#4,191 |
| 79. | Woodbine | 8.0% | 19.3%(-11.3)#79 | 17.0%(-8.98)#4,197 |
| 80. | Commerce | 8.0% | 19.3%(-11.2)#80 | 17.0%(-8.94)#4,230 |
| 81. | Evans | 8.1% | 19.3%(-11.2)#81 | 17.0%(-8.89)#4,260 |
| 82. | Lula | 8.1% | 19.3%(-11.1)#82 | 17.0%(-8.85)#4,294 |
| 83. | Pitts | 8.2% | 19.3%(-11.1)#83 | 17.0%(-8.81)#4,316 |
| 84. | Oxford | 8.2% | 19.3%(-11.1)#84 | 17.0%(-8.79)#4,322 |
| 85. | Portal | 8.3% | 19.3%(-10.9)#85 | 17.0%(-8.64)#4,390 |
| 86. | Rocky Ford | 8.3% | 19.3%(-10.9)#86 | 17.0%(-8.64)#4,408 |
| 87. | Montezuma | 8.8% | 19.3%(-10.5)#87 | 17.0%(-8.16)#4,644 |
| 88. | Auburn | 9.0% | 19.3%(-10.3)#88 | 17.0%(-8.00)#4,709 |
| 89. | Ila | 9.1% | 19.3%(-10.2)#89 | 17.0%(-7.89)#4,782 |
| 90. | Dearing | 9.2% | 19.3%(-10.1)#90 | 17.0%(-7.77)#4,833 |
| 91. | Dallas | 9.4% | 19.3%(-9.84)#91 | 17.0%(-7.54)#4,969 |
| 92. | Blythe | 9.5% | 19.3%(-9.75)#92 | 17.0%(-7.45)#5,008 |
| 93. | Milner | 9.5% | 19.3%(-9.75)#93 | 17.0%(-7.45)#5,010 |
| 94. | Trenton | 9.6% | 19.3%(-9.66)#94 | 17.0%(-7.36)#5,062 |
| 95. | Glennville | 9.9% | 19.3%(-9.35)#95 | 17.0%(-7.05)#5,225 |
| 96. | Ephesus | 10.0% | 19.3%(-9.28)#96 | 17.0%(-6.98)#5,249 |
| 97. | Peachtree Corners | 10.0% | 19.3%(-9.25)#97 | 17.0%(-6.95)#5,284 |
| 98. | Ludowici | 10.1% | 19.3%(-9.23)#98 | 17.0%(-6.92)#5,296 |
| 99. | Dunwoody | 10.1% | 19.3%(-9.13)#99 | 17.0%(-6.83)#5,341 |
| 100. | Turin | 10.3% | 19.3%(-8.93)#100 | 17.0%(-6.63)#5,450 |
Common Questions
What are the Top 10 Cities with the Lowest Child Poverty Level Among Girls Under the Age of 16 in Georgia?
Top 10 Cities with the Lowest Child Poverty Level Among Girls Under the Age of 16 in Georgia are:
#1
0.37%
#2
1.0%
#3
1.1%
#4
1.1%
#5
1.2%
#6
1.4%
#7
1.4%
#8
1.4%
#9
1.8%
#10
1.9%
What city has the Lowest Child Poverty Level Among Girls Under the Age of 16 in Georgia?
Dacula has the Lowest Child Poverty Level Among Girls Under the Age of 16 in Georgia with 0.37%.
What is the Poverty Level Among Girls Under the Age of 16 in the State of Georgia?
Poverty Level Among Girls Under the Age of 16 in Georgia is 19.3%.
What is the Poverty Level Among Girls Under the Age of 16 in the United States?
Poverty Level Among Girls Under the Age of 16 in the United States is 17.0%.