Cities with the Lowest Child Poverty Level Among Girls Under the Age of 16 in Pennsylvania
RELATED REPORTS & OPTIONS
Lowest Poverty | Girls 0-16
Pennsylvania
Compare Cities
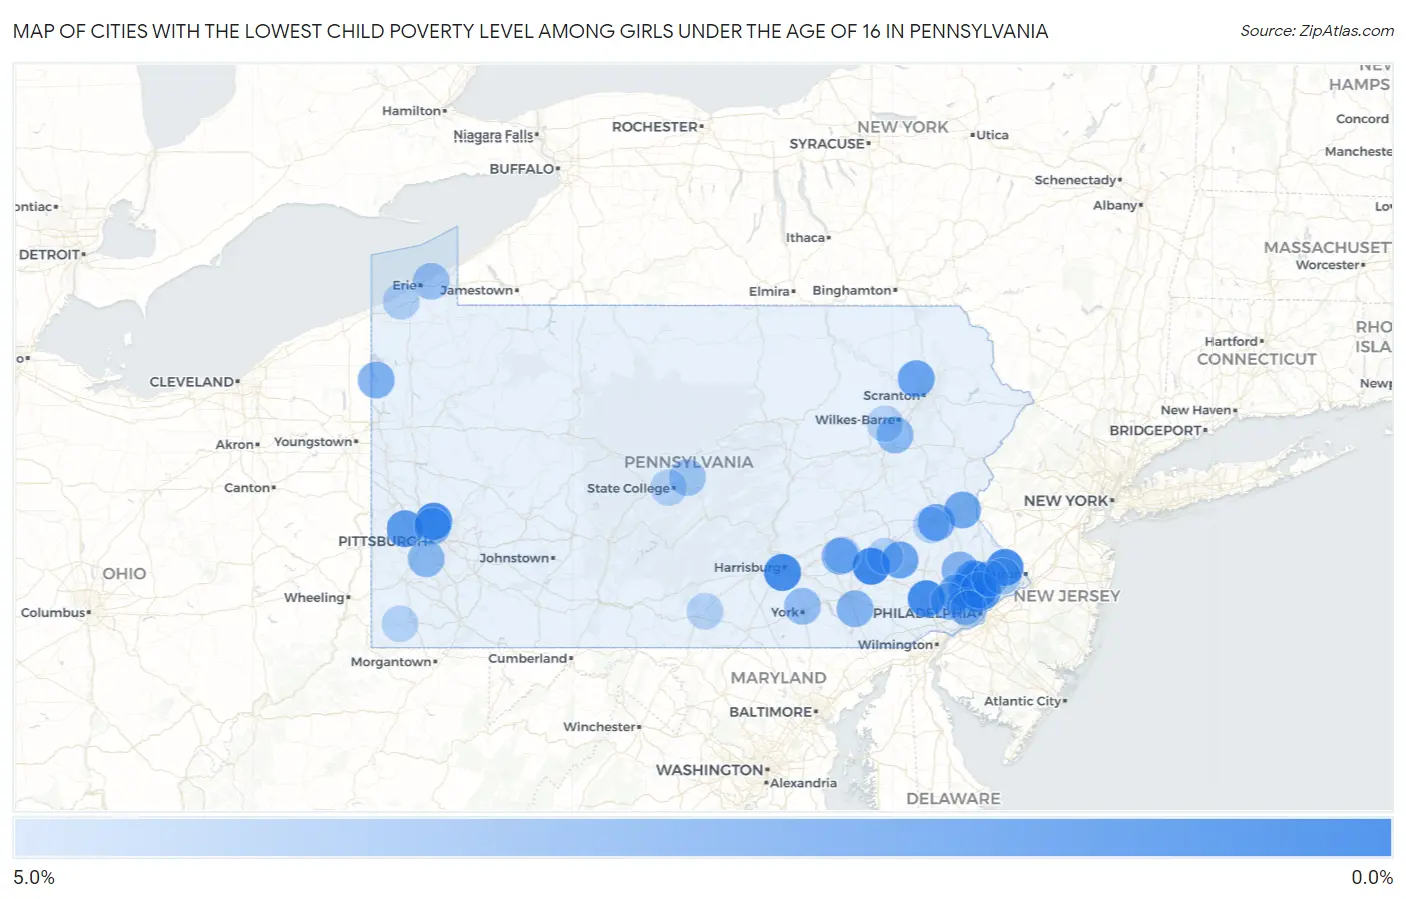
Map of Cities with the Lowest Child Poverty Level Among Girls Under the Age of 16 in Pennsylvania
5.0%
0.0%
Cities with the Lowest Child Poverty Level Among Girls Under the Age of 16 in Pennsylvania
| City | Child Poverty (Girls) | vs State | vs National | |
| 1. | Roslyn | 0.35% | 16.5%(-16.1)#1 | 17.0%(-16.6)#17 |
| 2. | Reinholds | 0.50% | 16.5%(-16.0)#2 | 17.0%(-16.5)#42 |
| 3. | Conshohocken Borough | 0.69% | 16.5%(-15.8)#3 | 17.0%(-16.3)#74 |
| 4. | Newtown Grant | 0.70% | 16.5%(-15.8)#4 | 17.0%(-16.3)#76 |
| 5. | Lionville | 0.72% | 16.5%(-15.8)#5 | 17.0%(-16.3)#79 |
| 6. | Lower Allen | 0.78% | 16.5%(-15.7)#6 | 17.0%(-16.2)#96 |
| 7. | Allison Park | 0.87% | 16.5%(-15.6)#7 | 17.0%(-16.1)#119 |
| 8. | Lititz Borough | 1.4% | 16.5%(-15.1)#8 | 17.0%(-15.6)#304 |
| 9. | Factoryville Borough | 1.4% | 16.5%(-15.1)#9 | 17.0%(-15.6)#310 |
| 10. | Lewisberry Borough | 1.4% | 16.5%(-15.1)#10 | 17.0%(-15.5)#334 |
| 11. | Carnot Moon | 1.5% | 16.5%(-15.0)#11 | 17.0%(-15.5)#337 |
| 12. | Maple Glen | 1.5% | 16.5%(-15.0)#12 | 17.0%(-15.5)#352 |
| 13. | Frazer | 1.5% | 16.5%(-15.0)#13 | 17.0%(-15.5)#358 |
| 14. | Wyndmoor | 1.5% | 16.5%(-15.0)#14 | 17.0%(-15.4)#367 |
| 15. | Glenside | 1.6% | 16.5%(-14.9)#15 | 17.0%(-15.4)#378 |
| 16. | York Haven Borough | 1.6% | 16.5%(-14.9)#16 | 17.0%(-15.3)#407 |
| 17. | Plymouth Meeting | 1.6% | 16.5%(-14.9)#17 | 17.0%(-15.3)#408 |
| 18. | Merion Station | 1.6% | 16.5%(-14.9)#18 | 17.0%(-15.3)#409 |
| 19. | Emmaus Borough | 1.7% | 16.5%(-14.8)#19 | 17.0%(-15.3)#425 |
| 20. | Castle Shannon Borough | 1.7% | 16.5%(-14.8)#20 | 17.0%(-15.3)#445 |
| 21. | Hyde Park Borough | 1.8% | 16.5%(-14.7)#21 | 17.0%(-15.2)#470 |
| 22. | Villanova | 1.8% | 16.5%(-14.7)#22 | 17.0%(-15.2)#482 |
| 23. | Port Carbon Borough | 1.8% | 16.5%(-14.7)#23 | 17.0%(-15.2)#502 |
| 24. | Reiffton | 1.8% | 16.5%(-14.7)#24 | 17.0%(-15.1)#513 |
| 25. | Spring House | 1.8% | 16.5%(-14.7)#25 | 17.0%(-15.1)#514 |
| 26. | Glenburn | 1.9% | 16.5%(-14.6)#26 | 17.0%(-15.1)#521 |
| 27. | Manorville Borough | 1.9% | 16.5%(-14.6)#27 | 17.0%(-15.1)#524 |
| 28. | Canonsburg Borough | 1.9% | 16.5%(-14.6)#28 | 17.0%(-15.1)#525 |
| 29. | Doylestown Borough | 1.9% | 16.5%(-14.6)#29 | 17.0%(-15.1)#529 |
| 30. | Wescosville | 1.9% | 16.5%(-14.6)#30 | 17.0%(-15.1)#543 |
| 31. | Oakmont Borough | 2.0% | 16.5%(-14.5)#31 | 17.0%(-15.0)#564 |
| 32. | Mount Wolf Borough | 2.1% | 16.5%(-14.4)#32 | 17.0%(-14.9)#621 |
| 33. | Middletown | 2.1% | 16.5%(-14.4)#33 | 17.0%(-14.9)#624 |
| 34. | Clarion Borough | 2.2% | 16.5%(-14.3)#34 | 17.0%(-14.8)#695 |
| 35. | Trafford Borough | 2.2% | 16.5%(-14.3)#35 | 17.0%(-14.8)#704 |
| 36. | New Britain Borough | 2.3% | 16.5%(-14.2)#36 | 17.0%(-14.7)#778 |
| 37. | Jacobus Borough | 2.4% | 16.5%(-14.1)#37 | 17.0%(-14.6)#801 |
| 38. | Duboistown Borough | 2.4% | 16.5%(-14.1)#38 | 17.0%(-14.6)#829 |
| 39. | Dunmore Borough | 2.4% | 16.5%(-14.1)#39 | 17.0%(-14.6)#833 |
| 40. | Pymatuning South | 2.4% | 16.5%(-14.1)#40 | 17.0%(-14.5)#846 |
| 41. | Hebron | 2.5% | 16.5%(-14.0)#41 | 17.0%(-14.5)#865 |
| 42. | Kulpsville | 2.6% | 16.5%(-13.9)#42 | 17.0%(-14.4)#930 |
| 43. | King Of Prussia | 2.6% | 16.5%(-13.9)#43 | 17.0%(-14.4)#931 |
| 44. | Glenshaw | 2.6% | 16.5%(-13.9)#44 | 17.0%(-14.4)#938 |
| 45. | Grampian Borough | 2.6% | 16.5%(-13.9)#45 | 17.0%(-14.3)#951 |
| 46. | Downingtown Borough | 2.6% | 16.5%(-13.9)#46 | 17.0%(-14.3)#958 |
| 47. | Willow Street | 2.7% | 16.5%(-13.8)#47 | 17.0%(-14.3)#965 |
| 48. | Leesport Borough | 2.7% | 16.5%(-13.8)#48 | 17.0%(-14.3)#979 |
| 49. | Tremont Borough | 2.8% | 16.5%(-13.7)#49 | 17.0%(-14.2)#1,022 |
| 50. | Bethel Park | 2.8% | 16.5%(-13.7)#50 | 17.0%(-14.2)#1,029 |
| 51. | Loganton Borough | 2.8% | 16.5%(-13.7)#51 | 17.0%(-14.2)#1,044 |
| 52. | Mountain Top | 2.8% | 16.5%(-13.7)#52 | 17.0%(-14.2)#1,068 |
| 53. | Collegeville Borough | 2.9% | 16.5%(-13.6)#53 | 17.0%(-14.1)#1,093 |
| 54. | Ardmore | 2.9% | 16.5%(-13.6)#54 | 17.0%(-14.1)#1,099 |
| 55. | New Salem Borough | 2.9% | 16.5%(-13.6)#55 | 17.0%(-14.1)#1,111 |
| 56. | Berwyn | 2.9% | 16.5%(-13.6)#56 | 17.0%(-14.1)#1,114 |
| 57. | Palo Alto Borough | 2.9% | 16.5%(-13.6)#57 | 17.0%(-14.0)#1,139 |
| 58. | Wellsboro Borough | 3.0% | 16.5%(-13.5)#58 | 17.0%(-14.0)#1,158 |
| 59. | North Wales Borough | 3.0% | 16.5%(-13.5)#59 | 17.0%(-14.0)#1,162 |
| 60. | Windber Borough | 3.0% | 16.5%(-13.5)#60 | 17.0%(-14.0)#1,179 |
| 61. | Emigsville | 3.1% | 16.5%(-13.4)#61 | 17.0%(-13.9)#1,215 |
| 62. | Ingram Borough | 3.1% | 16.5%(-13.4)#62 | 17.0%(-13.9)#1,218 |
| 63. | Oreland | 3.1% | 16.5%(-13.4)#63 | 17.0%(-13.9)#1,236 |
| 64. | Sewickley Heights Borough | 3.1% | 16.5%(-13.4)#64 | 17.0%(-13.9)#1,251 |
| 65. | Brookhaven Borough | 3.2% | 16.5%(-13.3)#65 | 17.0%(-13.8)#1,265 |
| 66. | Harmony Borough | 3.2% | 16.5%(-13.3)#66 | 17.0%(-13.8)#1,278 |
| 67. | Northwest Harborcreek | 3.2% | 16.5%(-13.3)#67 | 17.0%(-13.8)#1,291 |
| 68. | Mifflinburg Borough | 3.2% | 16.5%(-13.3)#68 | 17.0%(-13.7)#1,320 |
| 69. | Catasauqua Borough | 3.3% | 16.5%(-13.2)#69 | 17.0%(-13.7)#1,334 |
| 70. | Rockledge Borough | 3.3% | 16.5%(-13.2)#70 | 17.0%(-13.7)#1,360 |
| 71. | Pleasant Gap | 3.3% | 16.5%(-13.2)#71 | 17.0%(-13.7)#1,365 |
| 72. | Village Shires | 3.3% | 16.5%(-13.2)#72 | 17.0%(-13.7)#1,368 |
| 73. | Clarks Summit Borough | 3.3% | 16.5%(-13.2)#73 | 17.0%(-13.7)#1,374 |
| 74. | Nescopeck Borough | 3.3% | 16.5%(-13.2)#74 | 17.0%(-13.6)#1,382 |
| 75. | Newville Borough | 3.3% | 16.5%(-13.2)#75 | 17.0%(-13.6)#1,383 |
| 76. | Mayfield Borough | 3.4% | 16.5%(-13.1)#76 | 17.0%(-13.6)#1,416 |
| 77. | Evans City Borough | 3.4% | 16.5%(-13.1)#77 | 17.0%(-13.5)#1,442 |
| 78. | Plum Borough | 3.5% | 16.5%(-13.0)#78 | 17.0%(-13.5)#1,484 |
| 79. | Bowmanstown Borough | 3.6% | 16.5%(-12.9)#79 | 17.0%(-13.4)#1,561 |
| 80. | Lewis Run Borough | 3.7% | 16.5%(-12.8)#80 | 17.0%(-13.3)#1,600 |
| 81. | Hughestown Borough | 3.7% | 16.5%(-12.8)#81 | 17.0%(-13.2)#1,627 |
| 82. | Leetsdale Borough | 3.7% | 16.5%(-12.8)#82 | 17.0%(-13.2)#1,629 |
| 83. | Lanesboro Borough | 3.8% | 16.5%(-12.7)#83 | 17.0%(-13.2)#1,643 |
| 84. | Fairview | 3.8% | 16.5%(-12.7)#84 | 17.0%(-13.2)#1,653 |
| 85. | Penn Wynne | 3.8% | 16.5%(-12.7)#85 | 17.0%(-13.1)#1,681 |
| 86. | Wheatland Borough | 3.8% | 16.5%(-12.7)#86 | 17.0%(-13.1)#1,697 |
| 87. | Warminster Heights | 3.9% | 16.5%(-12.6)#87 | 17.0%(-13.1)#1,708 |
| 88. | Boyertown Borough | 3.9% | 16.5%(-12.6)#88 | 17.0%(-13.1)#1,717 |
| 89. | Whitfield | 3.9% | 16.5%(-12.6)#89 | 17.0%(-13.1)#1,735 |
| 90. | Park Forest Village | 3.9% | 16.5%(-12.6)#90 | 17.0%(-13.1)#1,743 |
| 91. | Coopersburg Borough | 3.9% | 16.5%(-12.6)#91 | 17.0%(-13.0)#1,759 |
| 92. | Avon | 3.9% | 16.5%(-12.6)#92 | 17.0%(-13.0)#1,761 |
| 93. | Trexlertown | 4.0% | 16.5%(-12.5)#93 | 17.0%(-13.0)#1,765 |
| 94. | Ford City Borough | 4.0% | 16.5%(-12.5)#94 | 17.0%(-13.0)#1,768 |
| 95. | Scotland | 4.0% | 16.5%(-12.5)#95 | 17.0%(-13.0)#1,787 |
| 96. | Mount Jewett Borough | 4.0% | 16.5%(-12.5)#96 | 17.0%(-13.0)#1,789 |
| 97. | West Nanticoke | 4.0% | 16.5%(-12.5)#97 | 17.0%(-13.0)#1,790 |
| 98. | Rices Landing Borough | 4.0% | 16.5%(-12.5)#98 | 17.0%(-13.0)#1,793 |
| 99. | Rogersville | 4.0% | 16.5%(-12.5)#99 | 17.0%(-13.0)#1,796 |
| 100. | Freeburg Borough | 4.1% | 16.5%(-12.4)#100 | 17.0%(-12.9)#1,825 |
Common Questions
What are the Top 10 Cities with the Lowest Child Poverty Level Among Girls Under the Age of 16 in Pennsylvania?
Top 10 Cities with the Lowest Child Poverty Level Among Girls Under the Age of 16 in Pennsylvania are:
#1
0.50%
#2
0.70%
#3
0.72%
#4
0.78%
#5
0.87%
#6
1.5%
#7
1.5%
#8
1.5%
#9
1.6%
#10
1.6%
What city has the Lowest Child Poverty Level Among Girls Under the Age of 16 in Pennsylvania?
Reinholds has the Lowest Child Poverty Level Among Girls Under the Age of 16 in Pennsylvania with 0.50%.
What is the Poverty Level Among Girls Under the Age of 16 in the State of Pennsylvania?
Poverty Level Among Girls Under the Age of 16 in Pennsylvania is 16.5%.
What is the Poverty Level Among Girls Under the Age of 16 in the United States?
Poverty Level Among Girls Under the Age of 16 in the United States is 17.0%.