Cities with the Lowest Child Poverty Level Among Girls Under the Age of 16 in Michigan
RELATED REPORTS & OPTIONS
Lowest Poverty | Girls 0-16
Michigan
Compare Cities
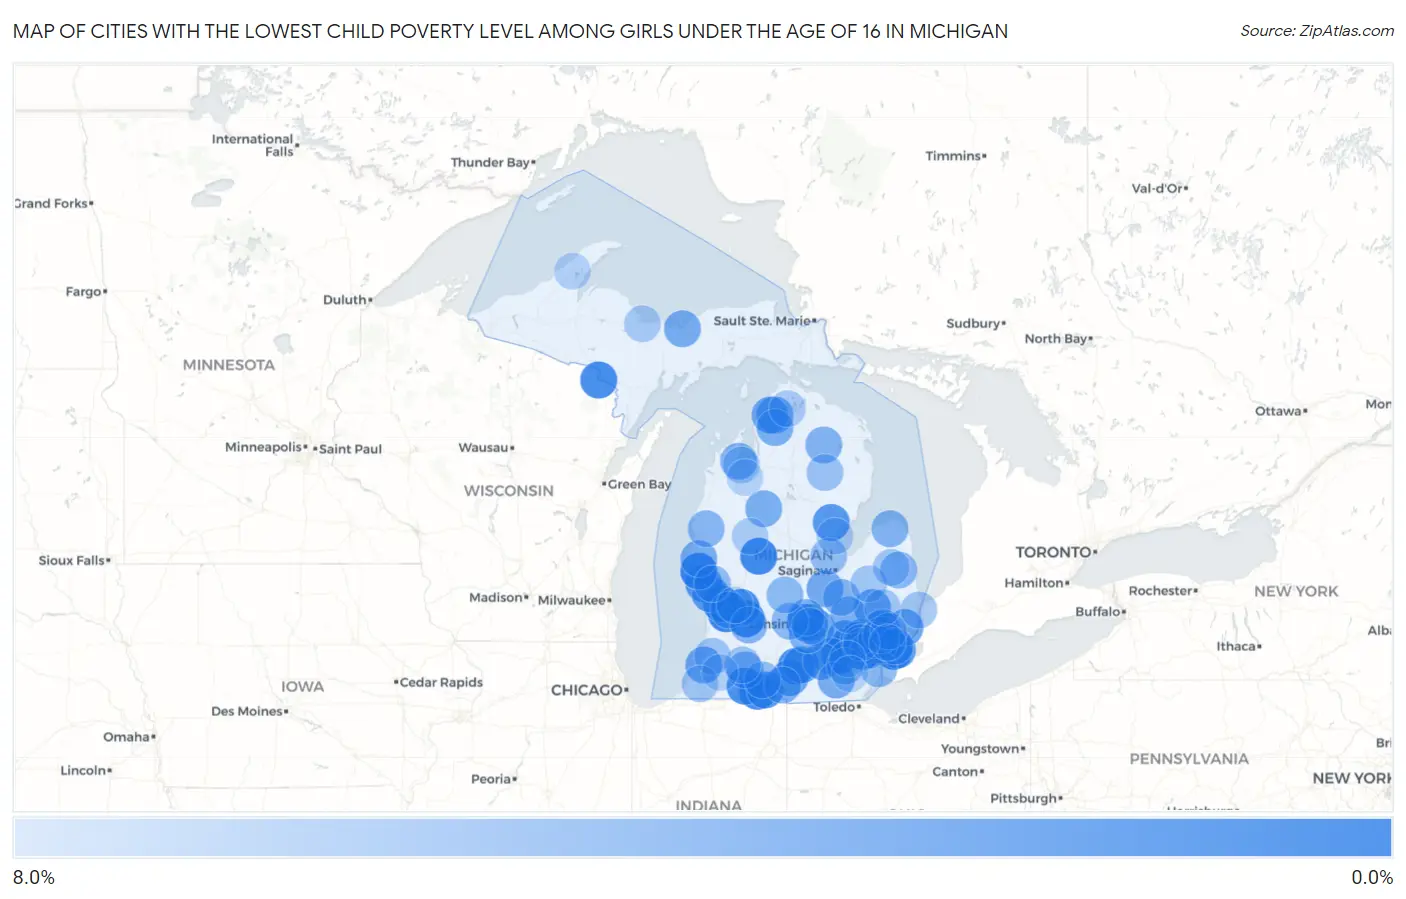
Map of Cities with the Lowest Child Poverty Level Among Girls Under the Age of 16 in Michigan
8.0%
0.0%
Cities with the Lowest Child Poverty Level Among Girls Under the Age of 16 in Michigan
| City | Child Poverty (Girls) | vs State | vs National | |
| 1. | Plymouth | 0.55% | 18.3%(-17.8)#1 | 17.0%(-16.4)#51 |
| 2. | Hudsonville | 0.74% | 18.3%(-17.6)#2 | 17.0%(-16.2)#82 |
| 3. | Berkley | 0.83% | 18.3%(-17.5)#3 | 17.0%(-16.1)#104 |
| 4. | Caledonia | 0.87% | 18.3%(-17.5)#4 | 17.0%(-16.1)#116 |
| 5. | Grosse Pointe Park | 0.89% | 18.3%(-17.4)#5 | 17.0%(-16.1)#131 |
| 6. | Canadian Lakes | 1.0% | 18.3%(-17.3)#6 | 17.0%(-15.9)#178 |
| 7. | Burr Oak | 1.2% | 18.3%(-17.1)#7 | 17.0%(-15.7)#242 |
| 8. | Kingsford | 1.3% | 18.3%(-17.0)#8 | 17.0%(-15.7)#263 |
| 9. | South Lyon | 1.4% | 18.3%(-17.0)#9 | 17.0%(-15.6)#298 |
| 10. | East Grand Rapids | 1.4% | 18.3%(-17.0)#10 | 17.0%(-15.6)#303 |
| 11. | Ferndale | 1.5% | 18.3%(-16.8)#11 | 17.0%(-15.5)#359 |
| 12. | Allendale | 1.6% | 18.3%(-16.7)#12 | 17.0%(-15.4)#393 |
| 13. | Concord | 1.6% | 18.3%(-16.7)#13 | 17.0%(-15.4)#394 |
| 14. | Centreville | 1.7% | 18.3%(-16.6)#14 | 17.0%(-15.3)#432 |
| 15. | Dexter | 1.8% | 18.3%(-16.6)#15 | 17.0%(-15.2)#473 |
| 16. | Bronson | 2.0% | 18.3%(-16.3)#16 | 17.0%(-15.0)#581 |
| 17. | North Muskegon | 2.2% | 18.3%(-16.1)#17 | 17.0%(-14.8)#707 |
| 18. | Sterling | 2.3% | 18.3%(-16.0)#18 | 17.0%(-14.7)#783 |
| 19. | Whitmore Lake | 2.6% | 18.3%(-15.8)#19 | 17.0%(-14.4)#927 |
| 20. | Brighton | 2.7% | 18.3%(-15.6)#20 | 17.0%(-14.2)#1,019 |
| 21. | Fruitport | 2.8% | 18.3%(-15.6)#21 | 17.0%(-14.2)#1,025 |
| 22. | Grosse Pointe Farms | 2.9% | 18.3%(-15.4)#22 | 17.0%(-14.1)#1,100 |
| 23. | Litchfield | 3.0% | 18.3%(-15.3)#23 | 17.0%(-14.0)#1,177 |
| 24. | Wolverine Lake | 3.1% | 18.3%(-15.2)#24 | 17.0%(-13.9)#1,242 |
| 25. | Haslett | 3.1% | 18.3%(-15.2)#25 | 17.0%(-13.9)#1,244 |
| 26. | Farmington Hills | 3.2% | 18.3%(-15.2)#26 | 17.0%(-13.8)#1,267 |
| 27. | Birmingham | 3.2% | 18.3%(-15.1)#27 | 17.0%(-13.8)#1,279 |
| 28. | Whitehall | 3.2% | 18.3%(-15.1)#28 | 17.0%(-13.8)#1,299 |
| 29. | Metamora | 3.2% | 18.3%(-15.1)#29 | 17.0%(-13.8)#1,305 |
| 30. | East Lansing | 3.2% | 18.3%(-15.1)#30 | 17.0%(-13.7)#1,315 |
| 31. | Chelsea | 3.3% | 18.3%(-15.1)#31 | 17.0%(-13.7)#1,343 |
| 32. | Spring Arbor | 3.3% | 18.3%(-15.0)#32 | 17.0%(-13.7)#1,348 |
| 33. | New Baltimore | 3.3% | 18.3%(-15.0)#33 | 17.0%(-13.7)#1,362 |
| 34. | Grass Lake | 3.4% | 18.3%(-14.9)#34 | 17.0%(-13.6)#1,404 |
| 35. | Williamston | 3.4% | 18.3%(-14.9)#35 | 17.0%(-13.6)#1,411 |
| 36. | Royal Oak | 3.4% | 18.3%(-14.9)#36 | 17.0%(-13.6)#1,425 |
| 37. | Watervliet | 3.4% | 18.3%(-14.9)#37 | 17.0%(-13.6)#1,436 |
| 38. | Petoskey | 3.5% | 18.3%(-14.8)#38 | 17.0%(-13.5)#1,472 |
| 39. | Farmington | 3.6% | 18.3%(-14.8)#39 | 17.0%(-13.4)#1,528 |
| 40. | Montague | 3.6% | 18.3%(-14.7)#40 | 17.0%(-13.4)#1,559 |
| 41. | Rochester | 3.6% | 18.3%(-14.7)#41 | 17.0%(-13.3)#1,565 |
| 42. | Bay Shore | 3.7% | 18.3%(-14.6)#42 | 17.0%(-13.3)#1,603 |
| 43. | Chesaning | 3.7% | 18.3%(-14.6)#43 | 17.0%(-13.3)#1,610 |
| 44. | Jenison | 3.8% | 18.3%(-14.5)#44 | 17.0%(-13.2)#1,652 |
| 45. | Wixom | 3.9% | 18.3%(-14.4)#45 | 17.0%(-13.0)#1,754 |
| 46. | Munising | 3.9% | 18.3%(-14.4)#46 | 17.0%(-13.0)#1,756 |
| 47. | Tecumseh | 4.0% | 18.3%(-14.3)#47 | 17.0%(-13.0)#1,780 |
| 48. | New Era | 4.0% | 18.3%(-14.3)#48 | 17.0%(-13.0)#1,794 |
| 49. | Rochester Hills | 4.0% | 18.3%(-14.3)#49 | 17.0%(-13.0)#1,798 |
| 50. | Lake Fenton | 4.2% | 18.3%(-14.2)#50 | 17.0%(-12.8)#1,890 |
| 51. | Mason | 4.2% | 18.3%(-14.1)#51 | 17.0%(-12.8)#1,910 |
| 52. | Boyne City | 4.2% | 18.3%(-14.1)#52 | 17.0%(-12.8)#1,915 |
| 53. | Mcbain | 4.2% | 18.3%(-14.1)#53 | 17.0%(-12.8)#1,937 |
| 54. | Bath | 4.3% | 18.3%(-14.1)#54 | 17.0%(-12.7)#1,958 |
| 55. | Huntington Woods | 4.4% | 18.3%(-13.9)#55 | 17.0%(-12.6)#2,049 |
| 56. | Vicksburg | 4.5% | 18.3%(-13.9)#56 | 17.0%(-12.5)#2,098 |
| 57. | Quincy | 4.5% | 18.3%(-13.9)#57 | 17.0%(-12.5)#2,103 |
| 58. | Greilickville | 4.5% | 18.3%(-13.8)#58 | 17.0%(-12.5)#2,113 |
| 59. | Atlanta | 4.5% | 18.3%(-13.8)#59 | 17.0%(-12.4)#2,152 |
| 60. | Kinde | 4.5% | 18.3%(-13.8)#60 | 17.0%(-12.4)#2,158 |
| 61. | Flushing | 4.7% | 18.3%(-13.6)#61 | 17.0%(-12.3)#2,263 |
| 62. | Northville | 4.7% | 18.3%(-13.6)#62 | 17.0%(-12.2)#2,274 |
| 63. | Livonia | 4.8% | 18.3%(-13.5)#63 | 17.0%(-12.2)#2,307 |
| 64. | Beverly Hills | 4.8% | 18.3%(-13.5)#64 | 17.0%(-12.2)#2,323 |
| 65. | Middleville | 4.8% | 18.3%(-13.5)#65 | 17.0%(-12.1)#2,327 |
| 66. | Sandusky | 4.9% | 18.3%(-13.5)#66 | 17.0%(-12.1)#2,357 |
| 67. | Custer | 4.9% | 18.3%(-13.4)#67 | 17.0%(-12.1)#2,368 |
| 68. | Trenton | 5.0% | 18.3%(-13.3)#68 | 17.0%(-12.0)#2,464 |
| 69. | Saline | 5.0% | 18.3%(-13.3)#69 | 17.0%(-11.9)#2,485 |
| 70. | Grand Ledge | 5.1% | 18.3%(-13.2)#70 | 17.0%(-11.9)#2,497 |
| 71. | Hubbardston | 5.1% | 18.3%(-13.2)#71 | 17.0%(-11.8)#2,537 |
| 72. | Troy | 5.2% | 18.3%(-13.1)#72 | 17.0%(-11.8)#2,571 |
| 73. | Wolf Lake | 5.3% | 18.3%(-13.0)#73 | 17.0%(-11.7)#2,644 |
| 74. | Auburn | 5.5% | 18.3%(-12.9)#74 | 17.0%(-11.5)#2,706 |
| 75. | Grosse Pointe Woods | 5.6% | 18.3%(-12.8)#75 | 17.0%(-11.4)#2,746 |
| 76. | Sherwood | 5.6% | 18.3%(-12.8)#76 | 17.0%(-11.4)#2,763 |
| 77. | Utica | 5.8% | 18.3%(-12.5)#77 | 17.0%(-11.2)#2,896 |
| 78. | Mio | 5.9% | 18.3%(-12.4)#78 | 17.0%(-11.1)#2,947 |
| 79. | Portage | 6.1% | 18.3%(-12.2)#79 | 17.0%(-10.9)#3,075 |
| 80. | Marysville | 6.1% | 18.3%(-12.2)#80 | 17.0%(-10.9)#3,078 |
| 81. | Bangor | 6.1% | 18.3%(-12.2)#81 | 17.0%(-10.8)#3,106 |
| 82. | Berrien Springs | 6.1% | 18.3%(-12.2)#82 | 17.0%(-10.8)#3,110 |
| 83. | Fostoria | 6.2% | 18.3%(-12.1)#83 | 17.0%(-10.7)#3,165 |
| 84. | Snover | 6.2% | 18.3%(-12.1)#84 | 17.0%(-10.7)#3,184 |
| 85. | Hermansville | 6.3% | 18.3%(-12.0)#85 | 17.0%(-10.6)#3,226 |
| 86. | Dryden | 6.4% | 18.3%(-11.9)#86 | 17.0%(-10.6)#3,234 |
| 87. | Traverse City | 6.5% | 18.3%(-11.8)#87 | 17.0%(-10.5)#3,289 |
| 88. | Harvey | 6.6% | 18.3%(-11.7)#88 | 17.0%(-10.3)#3,379 |
| 89. | Novi | 6.7% | 18.3%(-11.6)#89 | 17.0%(-10.2)#3,452 |
| 90. | Alanson | 6.8% | 18.3%(-11.6)#90 | 17.0%(-10.2)#3,476 |
| 91. | Pinconning | 6.8% | 18.3%(-11.5)#91 | 17.0%(-10.2)#3,487 |
| 92. | Hersey | 6.8% | 18.3%(-11.5)#92 | 17.0%(-10.2)#3,515 |
| 93. | Center Line | 6.8% | 18.3%(-11.5)#93 | 17.0%(-10.2)#3,516 |
| 94. | Ann Arbor | 7.0% | 18.3%(-11.3)#94 | 17.0%(-9.99)#3,614 |
| 95. | Houghton | 7.1% | 18.3%(-11.2)#95 | 17.0%(-9.83)#3,691 |
| 96. | Decatur | 7.1% | 18.3%(-11.2)#96 | 17.0%(-9.83)#3,695 |
| 97. | Kingsley | 7.3% | 18.3%(-11.0)#97 | 17.0%(-9.70)#3,797 |
| 98. | Walker | 7.3% | 18.3%(-11.0)#98 | 17.0%(-9.66)#3,822 |
| 99. | Okemos | 7.3% | 18.3%(-11.0)#99 | 17.0%(-9.65)#3,823 |
| 100. | Milan | 7.4% | 18.3%(-10.9)#100 | 17.0%(-9.56)#3,880 |
Common Questions
What are the Top 10 Cities with the Lowest Child Poverty Level Among Girls Under the Age of 16 in Michigan?
Top 10 Cities with the Lowest Child Poverty Level Among Girls Under the Age of 16 in Michigan are:
#1
0.55%
#2
0.74%
#3
0.83%
#4
0.87%
#5
0.89%
#6
1.0%
#7
1.2%
#8
1.3%
#9
1.4%
#10
1.4%
What city has the Lowest Child Poverty Level Among Girls Under the Age of 16 in Michigan?
Plymouth has the Lowest Child Poverty Level Among Girls Under the Age of 16 in Michigan with 0.55%.
What is the Poverty Level Among Girls Under the Age of 16 in the State of Michigan?
Poverty Level Among Girls Under the Age of 16 in Michigan is 18.3%.
What is the Poverty Level Among Girls Under the Age of 16 in the United States?
Poverty Level Among Girls Under the Age of 16 in the United States is 17.0%.