Cities with the Lowest Child Poverty Level Among Girls Under the Age of 16 in South Dakota
RELATED REPORTS & OPTIONS
Lowest Poverty | Girls 0-16
South Dakota
Compare Cities
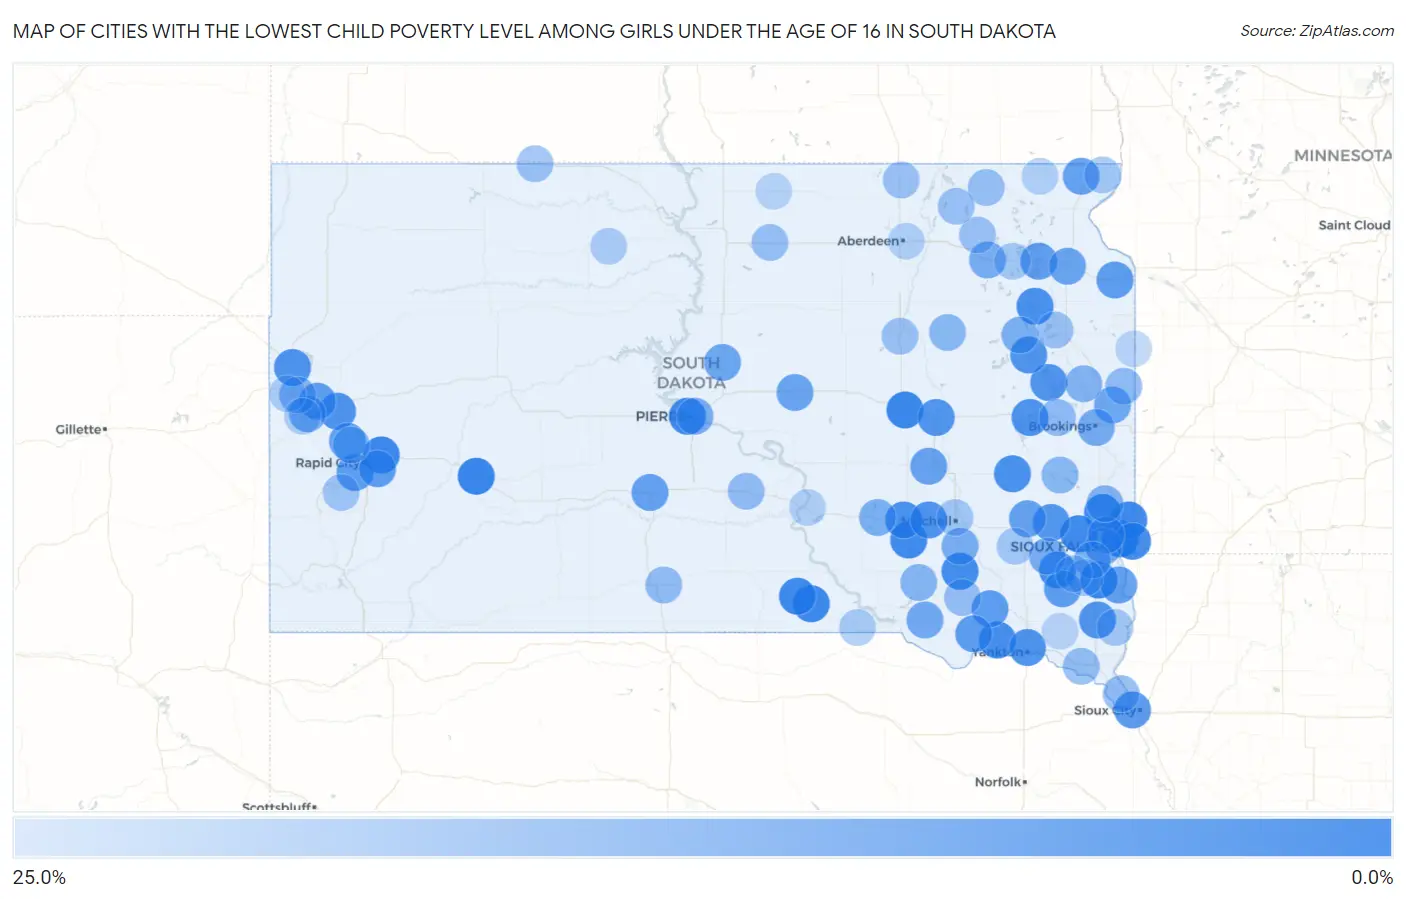
Map of Cities with the Lowest Child Poverty Level Among Girls Under the Age of 16 in South Dakota
25.0%
0.0%
Cities with the Lowest Child Poverty Level Among Girls Under the Age of 16 in South Dakota
| City | Child Poverty (Girls) | vs State | vs National | |
| 1. | Wall | 1.3% | 15.7%(-14.4)#1 | 17.0%(-15.7)#283 |
| 2. | Wolsey | 1.6% | 15.7%(-14.1)#2 | 17.0%(-15.4)#382 |
| 3. | Brandon | 1.7% | 15.7%(-14.0)#3 | 17.0%(-15.3)#436 |
| 4. | Worthing | 1.8% | 15.7%(-13.9)#4 | 17.0%(-15.2)#498 |
| 5. | Box Elder | 2.1% | 15.7%(-13.6)#5 | 17.0%(-14.9)#631 |
| 6. | Fort Pierre | 2.2% | 15.7%(-13.5)#6 | 17.0%(-14.8)#691 |
| 7. | Garretson | 2.2% | 15.7%(-13.4)#7 | 17.0%(-14.8)#721 |
| 8. | Baltic | 2.3% | 15.7%(-13.4)#8 | 17.0%(-14.7)#754 |
| 9. | Burke | 2.3% | 15.7%(-13.3)#9 | 17.0%(-14.7)#782 |
| 10. | Stickney | 2.5% | 15.7%(-13.2)#10 | 17.0%(-14.5)#883 |
| 11. | Hartford | 2.6% | 15.7%(-13.1)#11 | 17.0%(-14.4)#939 |
| 12. | Gregory | 2.7% | 15.7%(-13.0)#12 | 17.0%(-14.3)#983 |
| 13. | Valley Springs | 2.9% | 15.7%(-12.8)#13 | 17.0%(-14.1)#1,119 |
| 14. | Parkston | 3.1% | 15.7%(-12.5)#14 | 17.0%(-13.8)#1,258 |
| 15. | Parker | 3.6% | 15.7%(-12.0)#15 | 17.0%(-13.3)#1,577 |
| 16. | Tabor | 3.8% | 15.7%(-11.9)#16 | 17.0%(-13.2)#1,646 |
| 17. | Plankinton | 3.8% | 15.7%(-11.8)#17 | 17.0%(-13.1)#1,696 |
| 18. | Florence | 3.8% | 15.7%(-11.8)#18 | 17.0%(-13.1)#1,702 |
| 19. | Howard | 4.4% | 15.7%(-11.2)#19 | 17.0%(-12.5)#2,084 |
| 20. | Belle Fourche | 4.5% | 15.7%(-11.2)#20 | 17.0%(-12.5)#2,110 |
| 21. | Yankton | 4.5% | 15.7%(-11.2)#21 | 17.0%(-12.5)#2,131 |
| 22. | Sturgis | 4.5% | 15.7%(-11.1)#22 | 17.0%(-12.4)#2,139 |
| 23. | Mount Vernon | 4.7% | 15.7%(-11.0)#23 | 17.0%(-12.3)#2,240 |
| 24. | Lake Preston | 4.8% | 15.7%(-10.9)#24 | 17.0%(-12.2)#2,289 |
| 25. | Lake Norden | 4.9% | 15.7%(-10.8)#25 | 17.0%(-12.1)#2,381 |
| 26. | Hazel | 5.0% | 15.7%(-10.7)#26 | 17.0%(-12.0)#2,463 |
| 27. | Beresford | 5.1% | 15.7%(-10.6)#27 | 17.0%(-11.9)#2,499 |
| 28. | Huron | 5.2% | 15.7%(-10.5)#28 | 17.0%(-11.8)#2,583 |
| 29. | Montrose | 5.6% | 15.7%(-10.0)#29 | 17.0%(-11.3)#2,809 |
| 30. | Dakota Dunes | 6.4% | 15.7%(-9.28)#30 | 17.0%(-10.6)#3,242 |
| 31. | Colonial Pine Hills | 6.9% | 15.7%(-8.79)#31 | 17.0%(-10.1)#3,543 |
| 32. | Hurley | 6.9% | 15.7%(-8.77)#32 | 17.0%(-10.1)#3,562 |
| 33. | Scotland | 6.9% | 15.7%(-8.74)#33 | 17.0%(-10.0)#3,580 |
| 34. | Green Valley | 7.0% | 15.7%(-8.69)#34 | 17.0%(-10.00)#3,603 |
| 35. | Tyndall | 7.0% | 15.7%(-8.69)#35 | 17.0%(-10.00)#3,605 |
| 36. | Whitewood | 7.0% | 15.7%(-8.65)#36 | 17.0%(-9.96)#3,630 |
| 37. | Milbank | 7.3% | 15.7%(-8.40)#37 | 17.0%(-9.70)#3,783 |
| 38. | Waubay | 7.7% | 15.7%(-7.98)#38 | 17.0%(-9.28)#4,027 |
| 39. | Canton | 8.0% | 15.7%(-7.64)#39 | 17.0%(-8.95)#4,220 |
| 40. | Piedmont | 8.1% | 15.7%(-7.53)#40 | 17.0%(-8.84)#4,298 |
| 41. | Murdo | 8.3% | 15.7%(-7.34)#41 | 17.0%(-8.64)#4,389 |
| 42. | New Effington | 8.3% | 15.7%(-7.34)#42 | 17.0%(-8.64)#4,409 |
| 43. | Salem | 8.6% | 15.7%(-7.10)#43 | 17.0%(-8.40)#4,522 |
| 44. | Woonsocket | 8.7% | 15.7%(-6.93)#44 | 17.0%(-8.24)#4,606 |
| 45. | Summit | 9.3% | 15.7%(-6.37)#45 | 17.0%(-7.67)#4,891 |
| 46. | Highmore | 9.3% | 15.7%(-6.34)#46 | 17.0%(-7.64)#4,909 |
| 47. | Onida | 9.5% | 15.7%(-6.15)#47 | 17.0%(-7.45)#5,011 |
| 48. | White | 9.8% | 15.7%(-5.91)#48 | 17.0%(-7.22)#5,141 |
| 49. | Sioux Falls | 10.2% | 15.7%(-5.43)#49 | 17.0%(-6.73)#5,385 |
| 50. | Wagner | 10.3% | 15.7%(-5.38)#50 | 17.0%(-6.69)#5,410 |
| 51. | Meadow View Addition | 10.3% | 15.7%(-5.36)#51 | 17.0%(-6.67)#5,416 |
| 52. | Deadwood | 10.3% | 15.7%(-5.35)#52 | 17.0%(-6.66)#5,422 |
| 53. | Brookings | 10.8% | 15.7%(-4.88)#53 | 17.0%(-6.19)#5,695 |
| 54. | Bristol | 11.1% | 15.7%(-4.56)#54 | 17.0%(-5.86)#5,850 |
| 55. | Monroe | 11.1% | 15.7%(-4.56)#55 | 17.0%(-5.86)#5,852 |
| 56. | Ethan | 11.3% | 15.7%(-4.35)#56 | 17.0%(-5.66)#5,956 |
| 57. | Pierre | 11.8% | 15.7%(-3.91)#57 | 17.0%(-5.22)#6,139 |
| 58. | White Lake | 11.8% | 15.7%(-3.90)#58 | 17.0%(-5.21)#6,151 |
| 59. | Henry | 11.8% | 15.7%(-3.90)#59 | 17.0%(-5.21)#6,161 |
| 60. | Tea | 12.1% | 15.7%(-3.58)#60 | 17.0%(-4.89)#6,306 |
| 61. | Dell Rapids | 12.8% | 15.7%(-2.89)#61 | 17.0%(-4.20)#6,674 |
| 62. | Estelline | 12.8% | 15.7%(-2.89)#62 | 17.0%(-4.19)#6,676 |
| 63. | Spearfish | 13.0% | 15.7%(-2.63)#63 | 17.0%(-3.94)#6,777 |
| 64. | Armour | 13.5% | 15.7%(-2.16)#64 | 17.0%(-3.46)#7,006 |
| 65. | Summerset | 14.1% | 15.7%(-1.56)#65 | 17.0%(-2.87)#7,288 |
| 66. | Doland | 14.3% | 15.7%(-1.38)#66 | 17.0%(-2.69)#7,393 |
| 67. | Madison | 14.3% | 15.7%(-1.34)#67 | 17.0%(-2.64)#7,427 |
| 68. | Astoria | 15.0% | 15.7%(-0.669)#68 | 17.0%(-1.98)#7,709 |
| 69. | Jefferson | 15.2% | 15.7%(-0.517)#69 | 17.0%(-1.82)#7,777 |
| 70. | Kennebec | 15.2% | 15.7%(-0.517)#70 | 17.0%(-1.82)#7,784 |
| 71. | White Horse | 15.2% | 15.7%(-0.452)#71 | 17.0%(-1.76)#7,812 |
| 72. | Arlington | 15.3% | 15.7%(-0.402)#72 | 17.0%(-1.71)#7,839 |
| 73. | Vermillion | 15.6% | 15.7%(-0.079)#73 | 17.0%(-1.39)#8,006 |
| 74. | Tripp | 15.8% | 15.7%(+0.121)#74 | 17.0%(-1.19)#8,079 |
| 75. | Bowdle | 16.1% | 15.7%(+0.460)#75 | 17.0%(-0.847)#8,243 |
| 76. | Britton | 16.3% | 15.7%(+0.658)#76 | 17.0%(-0.650)#8,329 |
| 77. | Watertown | 16.4% | 15.7%(+0.739)#77 | 17.0%(-0.568)#8,360 |
| 78. | Redfield | 16.7% | 15.7%(+0.998)#78 | 17.0%(-0.309)#8,427 |
| 79. | Frederick | 16.7% | 15.7%(+0.998)#79 | 17.0%(-0.309)#8,479 |
| 80. | Pierpont | 16.7% | 15.7%(+0.998)#80 | 17.0%(-0.309)#8,495 |
| 81. | Claremont | 16.7% | 15.7%(+0.998)#81 | 17.0%(-0.309)#8,503 |
| 82. | Morristown | 16.7% | 15.7%(+0.998)#82 | 17.0%(-0.309)#8,504 |
| 83. | Keystone | 17.1% | 15.7%(+1.40)#83 | 17.0%(+0.097)#8,655 |
| 84. | Lennox | 17.8% | 15.7%(+2.12)#84 | 17.0%(+0.810)#8,941 |
| 85. | Rosholt | 17.9% | 15.7%(+2.19)#85 | 17.0%(+0.881)#8,969 |
| 86. | Bridgewater | 17.9% | 15.7%(+2.28)#86 | 17.0%(+0.973)#9,007 |
| 87. | Mitchell | 18.0% | 15.7%(+2.29)#87 | 17.0%(+0.985)#9,009 |
| 88. | Chancellor | 18.2% | 15.7%(+2.51)#88 | 17.0%(+1.21)#9,103 |
| 89. | Alcester | 18.3% | 15.7%(+2.59)#89 | 17.0%(+1.28)#9,136 |
| 90. | Webster | 18.3% | 15.7%(+2.64)#90 | 17.0%(+1.33)#9,158 |
| 91. | Fairfax | 19.0% | 15.7%(+3.38)#91 | 17.0%(+2.07)#9,447 |
| 92. | Timber Lake | 19.3% | 15.7%(+3.61)#92 | 17.0%(+2.30)#9,533 |
| 93. | North Spearfish | 19.5% | 15.7%(+3.84)#93 | 17.0%(+2.54)#9,609 |
| 94. | Aberdeen | 19.8% | 15.7%(+4.09)#94 | 17.0%(+2.78)#9,700 |
| 95. | Veblen | 20.0% | 15.7%(+4.33)#95 | 17.0%(+3.02)#9,804 |
| 96. | Central City | 20.0% | 15.7%(+4.33)#96 | 17.0%(+3.02)#9,853 |
| 97. | Chamberlain | 20.3% | 15.7%(+4.65)#97 | 17.0%(+3.34)#9,931 |
| 98. | Eureka | 21.0% | 15.7%(+5.33)#98 | 17.0%(+4.02)#10,177 |
| 99. | Gary | 21.1% | 15.7%(+5.38)#99 | 17.0%(+4.08)#10,202 |
| 100. | Wakonda | 21.2% | 15.7%(+5.54)#100 | 17.0%(+4.24)#10,247 |
Common Questions
What are the Top 10 Cities with the Lowest Child Poverty Level Among Girls Under the Age of 16 in South Dakota?
Top 10 Cities with the Lowest Child Poverty Level Among Girls Under the Age of 16 in South Dakota are:
What city has the Lowest Child Poverty Level Among Girls Under the Age of 16 in South Dakota?
Wall has the Lowest Child Poverty Level Among Girls Under the Age of 16 in South Dakota with 1.3%.
What is the Poverty Level Among Girls Under the Age of 16 in the State of South Dakota?
Poverty Level Among Girls Under the Age of 16 in South Dakota is 15.7%.
What is the Poverty Level Among Girls Under the Age of 16 in the United States?
Poverty Level Among Girls Under the Age of 16 in the United States is 17.0%.