Cities with the Lowest Child Poverty Level Among Girls Under the Age of 16 in Iowa
RELATED REPORTS & OPTIONS
Lowest Poverty | Girls 0-16
Iowa
Compare Cities
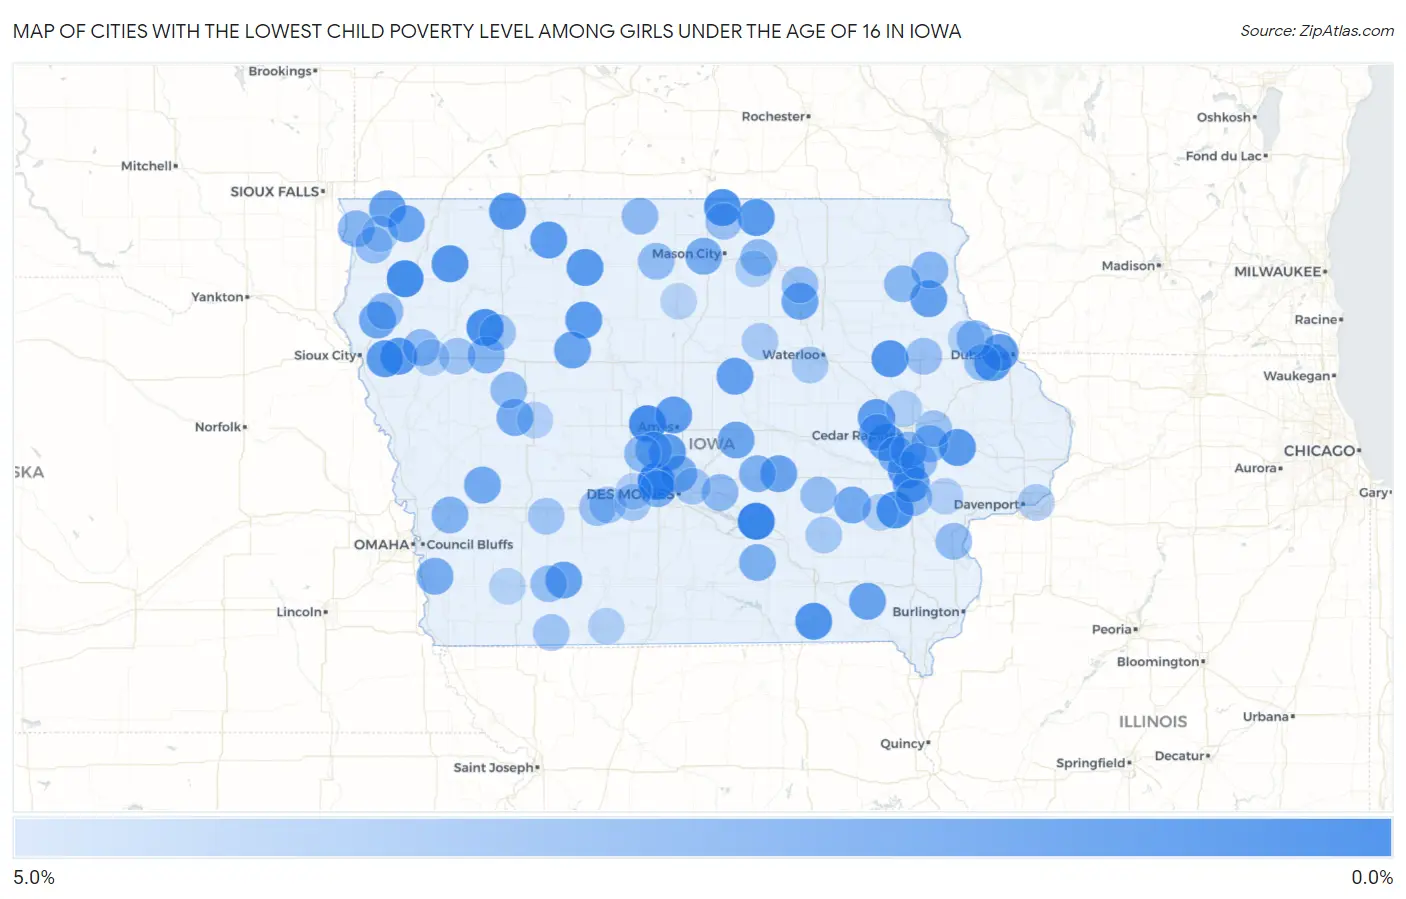
Map of Cities with the Lowest Child Poverty Level Among Girls Under the Age of 16 in Iowa
5.0%
0.0%
Cities with the Lowest Child Poverty Level Among Girls Under the Age of 16 in Iowa
| City | Child Poverty (Girls) | vs State | vs National | |
| 1. | Grimes | 0.37% | 12.9%(-12.6)#1 | 17.0%(-16.6)#23 |
| 2. | Pella | 0.45% | 12.9%(-12.5)#2 | 17.0%(-16.5)#33 |
| 3. | Alton | 0.85% | 12.9%(-12.1)#3 | 17.0%(-16.1)#108 |
| 4. | Boone | 0.87% | 12.9%(-12.1)#4 | 17.0%(-16.1)#121 |
| 5. | Alta | 1.0% | 12.9%(-11.9)#5 | 17.0%(-16.0)#168 |
| 6. | Northwood | 1.1% | 12.9%(-11.8)#6 | 17.0%(-15.9)#195 |
| 7. | Kalona | 1.2% | 12.9%(-11.7)#7 | 17.0%(-15.8)#227 |
| 8. | Bloomfield | 1.3% | 12.9%(-11.7)#8 | 17.0%(-15.7)#252 |
| 9. | Winthrop | 1.4% | 12.9%(-11.5)#9 | 17.0%(-15.6)#318 |
| 10. | Primghar | 1.4% | 12.9%(-11.5)#10 | 17.0%(-15.5)#329 |
| 11. | North Liberty | 1.5% | 12.9%(-11.5)#11 | 17.0%(-15.5)#345 |
| 12. | Spirit Lake | 1.5% | 12.9%(-11.4)#12 | 17.0%(-15.5)#347 |
| 13. | Moville | 1.5% | 12.9%(-11.4)#13 | 17.0%(-15.5)#357 |
| 14. | Whittemore | 1.5% | 12.9%(-11.4)#14 | 17.0%(-15.4)#365 |
| 15. | Fairfax | 1.5% | 12.9%(-11.4)#15 | 17.0%(-15.4)#368 |
| 16. | Peosta | 1.5% | 12.9%(-11.4)#16 | 17.0%(-15.4)#370 |
| 17. | St Ansgar | 1.6% | 12.9%(-11.4)#17 | 17.0%(-15.4)#381 |
| 18. | Stanwood | 1.6% | 12.9%(-11.3)#18 | 17.0%(-15.4)#388 |
| 19. | Gilmore City | 1.6% | 12.9%(-11.3)#19 | 17.0%(-15.4)#399 |
| 20. | Graettinger | 1.7% | 12.9%(-11.3)#20 | 17.0%(-15.3)#414 |
| 21. | Lawton | 1.8% | 12.9%(-11.2)#21 | 17.0%(-15.2)#468 |
| 22. | Sheldahl | 1.8% | 12.9%(-11.2)#22 | 17.0%(-15.2)#471 |
| 23. | Gilbert | 1.8% | 12.9%(-11.1)#23 | 17.0%(-15.2)#497 |
| 24. | Shellsburg | 1.8% | 12.9%(-11.1)#24 | 17.0%(-15.1)#510 |
| 25. | Eldora | 2.0% | 12.9%(-11.0)#25 | 17.0%(-15.0)#576 |
| 26. | University Heights | 2.0% | 12.9%(-10.9)#26 | 17.0%(-15.0)#585 |
| 27. | Asbury | 2.0% | 12.9%(-10.9)#27 | 17.0%(-15.0)#589 |
| 28. | Elkader | 2.0% | 12.9%(-10.9)#28 | 17.0%(-15.0)#591 |
| 29. | Rock Rapids | 2.1% | 12.9%(-10.9)#29 | 17.0%(-14.9)#632 |
| 30. | Prescott | 2.1% | 12.9%(-10.9)#30 | 17.0%(-14.9)#642 |
| 31. | Birmingham | 2.1% | 12.9%(-10.8)#31 | 17.0%(-14.8)#669 |
| 32. | Grinnell | 2.1% | 12.9%(-10.8)#32 | 17.0%(-14.8)#675 |
| 33. | Manson | 2.1% | 12.9%(-10.8)#33 | 17.0%(-14.8)#679 |
| 34. | George | 2.2% | 12.9%(-10.7)#34 | 17.0%(-14.8)#708 |
| 35. | Plainfield | 2.3% | 12.9%(-10.7)#35 | 17.0%(-14.7)#757 |
| 36. | Merrill | 2.4% | 12.9%(-10.6)#36 | 17.0%(-14.6)#795 |
| 37. | Melbourne | 2.4% | 12.9%(-10.6)#37 | 17.0%(-14.6)#796 |
| 38. | Harlan | 2.5% | 12.9%(-10.4)#38 | 17.0%(-14.5)#887 |
| 39. | Atkins | 2.5% | 12.9%(-10.4)#39 | 17.0%(-14.4)#906 |
| 40. | North English | 2.5% | 12.9%(-10.4)#40 | 17.0%(-14.4)#907 |
| 41. | Arcadia | 2.6% | 12.9%(-10.3)#41 | 17.0%(-14.3)#948 |
| 42. | Clear Lake | 2.7% | 12.9%(-10.3)#42 | 17.0%(-14.3)#970 |
| 43. | Glenwood | 2.7% | 12.9%(-10.3)#43 | 17.0%(-14.3)#973 |
| 44. | Ankeny | 2.7% | 12.9%(-10.2)#44 | 17.0%(-14.2)#1,010 |
| 45. | Lovilia | 2.9% | 12.9%(-10.1)#45 | 17.0%(-14.1)#1,086 |
| 46. | Clive | 2.9% | 12.9%(-10.1)#46 | 17.0%(-14.1)#1,094 |
| 47. | Madrid | 2.9% | 12.9%(-10.0)#47 | 17.0%(-14.1)#1,118 |
| 48. | Kellogg | 2.9% | 12.9%(-9.99)#48 | 17.0%(-14.0)#1,143 |
| 49. | Swisher | 3.0% | 12.9%(-9.89)#49 | 17.0%(-13.9)#1,207 |
| 50. | Schaller | 3.1% | 12.9%(-9.87)#50 | 17.0%(-13.9)#1,221 |
| 51. | Neola | 3.1% | 12.9%(-9.87)#51 | 17.0%(-13.9)#1,225 |
| 52. | Lisbon | 3.2% | 12.9%(-9.77)#52 | 17.0%(-13.8)#1,276 |
| 53. | Monona | 3.2% | 12.9%(-9.73)#53 | 17.0%(-13.8)#1,287 |
| 54. | Inwood | 3.2% | 12.9%(-9.71)#54 | 17.0%(-13.8)#1,303 |
| 55. | Elgin | 3.3% | 12.9%(-9.60)#55 | 17.0%(-13.6)#1,388 |
| 56. | Holy Cross | 3.3% | 12.9%(-9.60)#56 | 17.0%(-13.6)#1,394 |
| 57. | Woodward | 3.4% | 12.9%(-9.57)#57 | 17.0%(-13.6)#1,405 |
| 58. | Prairie City | 3.4% | 12.9%(-9.50)#58 | 17.0%(-13.5)#1,445 |
| 59. | Rudd | 3.4% | 12.9%(-9.49)#59 | 17.0%(-13.5)#1,458 |
| 60. | Le Mars | 3.5% | 12.9%(-9.47)#60 | 17.0%(-13.5)#1,464 |
| 61. | Ely | 3.5% | 12.9%(-9.47)#61 | 17.0%(-13.5)#1,465 |
| 62. | Buffalo Center | 3.5% | 12.9%(-9.43)#62 | 17.0%(-13.5)#1,493 |
| 63. | Pierson | 3.5% | 12.9%(-9.43)#63 | 17.0%(-13.5)#1,497 |
| 64. | Wall Lake | 3.6% | 12.9%(-9.36)#64 | 17.0%(-13.4)#1,544 |
| 65. | Britt | 3.6% | 12.9%(-9.33)#65 | 17.0%(-13.4)#1,556 |
| 66. | Hills | 3.6% | 12.9%(-9.32)#66 | 17.0%(-13.4)#1,562 |
| 67. | Rock Valley | 3.7% | 12.9%(-9.23)#67 | 17.0%(-13.3)#1,599 |
| 68. | Grandview | 3.7% | 12.9%(-9.23)#68 | 17.0%(-13.3)#1,605 |
| 69. | Epworth | 3.7% | 12.9%(-9.21)#69 | 17.0%(-13.3)#1,612 |
| 70. | Solon | 3.8% | 12.9%(-9.18)#70 | 17.0%(-13.2)#1,632 |
| 71. | Corning | 3.8% | 12.9%(-9.16)#71 | 17.0%(-13.2)#1,640 |
| 72. | Deep River | 3.8% | 12.9%(-9.16)#72 | 17.0%(-13.2)#1,647 |
| 73. | Manchester | 3.8% | 12.9%(-9.14)#73 | 17.0%(-13.2)#1,657 |
| 74. | Stuart | 3.8% | 12.9%(-9.13)#74 | 17.0%(-13.2)#1,665 |
| 75. | Nashua | 3.8% | 12.9%(-9.11)#75 | 17.0%(-13.2)#1,677 |
| 76. | Kensett | 3.8% | 12.9%(-9.09)#76 | 17.0%(-13.1)#1,704 |
| 77. | Storm Lake | 4.0% | 12.9%(-8.95)#77 | 17.0%(-13.0)#1,781 |
| 78. | Holstein | 4.1% | 12.9%(-8.88)#78 | 17.0%(-12.9)#1,822 |
| 79. | Martelle | 4.1% | 12.9%(-8.85)#79 | 17.0%(-12.9)#1,843 |
| 80. | Altoona | 4.1% | 12.9%(-8.84)#80 | 17.0%(-12.9)#1,854 |
| 81. | Anita | 4.1% | 12.9%(-8.83)#81 | 17.0%(-12.9)#1,862 |
| 82. | Dexter | 4.1% | 12.9%(-8.83)#82 | 17.0%(-12.9)#1,864 |
| 83. | Bedford | 4.1% | 12.9%(-8.80)#83 | 17.0%(-12.8)#1,876 |
| 84. | De Soto | 4.2% | 12.9%(-8.71)#84 | 17.0%(-12.8)#1,936 |
| 85. | Hudson | 4.3% | 12.9%(-8.59)#85 | 17.0%(-12.6)#2,016 |
| 86. | Delta | 4.3% | 12.9%(-8.59)#86 | 17.0%(-12.6)#2,027 |
| 87. | Riverdale | 4.4% | 12.9%(-8.49)#87 | 17.0%(-12.5)#2,089 |
| 88. | Aplington | 4.5% | 12.9%(-8.47)#88 | 17.0%(-12.5)#2,104 |
| 89. | Wellman | 4.5% | 12.9%(-8.39)#89 | 17.0%(-12.4)#2,147 |
| 90. | Rockford | 4.5% | 12.9%(-8.39)#90 | 17.0%(-12.4)#2,148 |
| 91. | Correctionville | 4.5% | 12.9%(-8.39)#91 | 17.0%(-12.4)#2,149 |
| 92. | Doon | 4.5% | 12.9%(-8.39)#92 | 17.0%(-12.4)#2,153 |
| 93. | Alburnett | 4.6% | 12.9%(-8.31)#93 | 17.0%(-12.3)#2,212 |
| 94. | Mount Ayr | 4.6% | 12.9%(-8.30)#94 | 17.0%(-12.3)#2,216 |
| 95. | West Liberty | 4.7% | 12.9%(-8.23)#95 | 17.0%(-12.3)#2,254 |
| 96. | Adel | 4.7% | 12.9%(-8.21)#96 | 17.0%(-12.2)#2,269 |
| 97. | Carroll | 4.7% | 12.9%(-8.21)#97 | 17.0%(-12.2)#2,270 |
| 98. | Luxemburg | 4.8% | 12.9%(-8.17)#98 | 17.0%(-12.2)#2,299 |
| 99. | Stanton | 4.8% | 12.9%(-8.10)#99 | 17.0%(-12.1)#2,336 |
| 100. | Belmond | 4.9% | 12.9%(-8.06)#100 | 17.0%(-12.1)#2,362 |
Common Questions
What are the Top 10 Cities with the Lowest Child Poverty Level Among Girls Under the Age of 16 in Iowa?
Top 10 Cities with the Lowest Child Poverty Level Among Girls Under the Age of 16 in Iowa are:
What city has the Lowest Child Poverty Level Among Girls Under the Age of 16 in Iowa?
Grimes has the Lowest Child Poverty Level Among Girls Under the Age of 16 in Iowa with 0.37%.
What is the Poverty Level Among Girls Under the Age of 16 in the State of Iowa?
Poverty Level Among Girls Under the Age of 16 in Iowa is 12.9%.
What is the Poverty Level Among Girls Under the Age of 16 in the United States?
Poverty Level Among Girls Under the Age of 16 in the United States is 17.0%.