Cities with the Lowest Child Poverty Level Among Girls Under the Age of 16 in Florida
RELATED REPORTS & OPTIONS
Lowest Poverty | Girls 0-16
Florida
Compare Cities
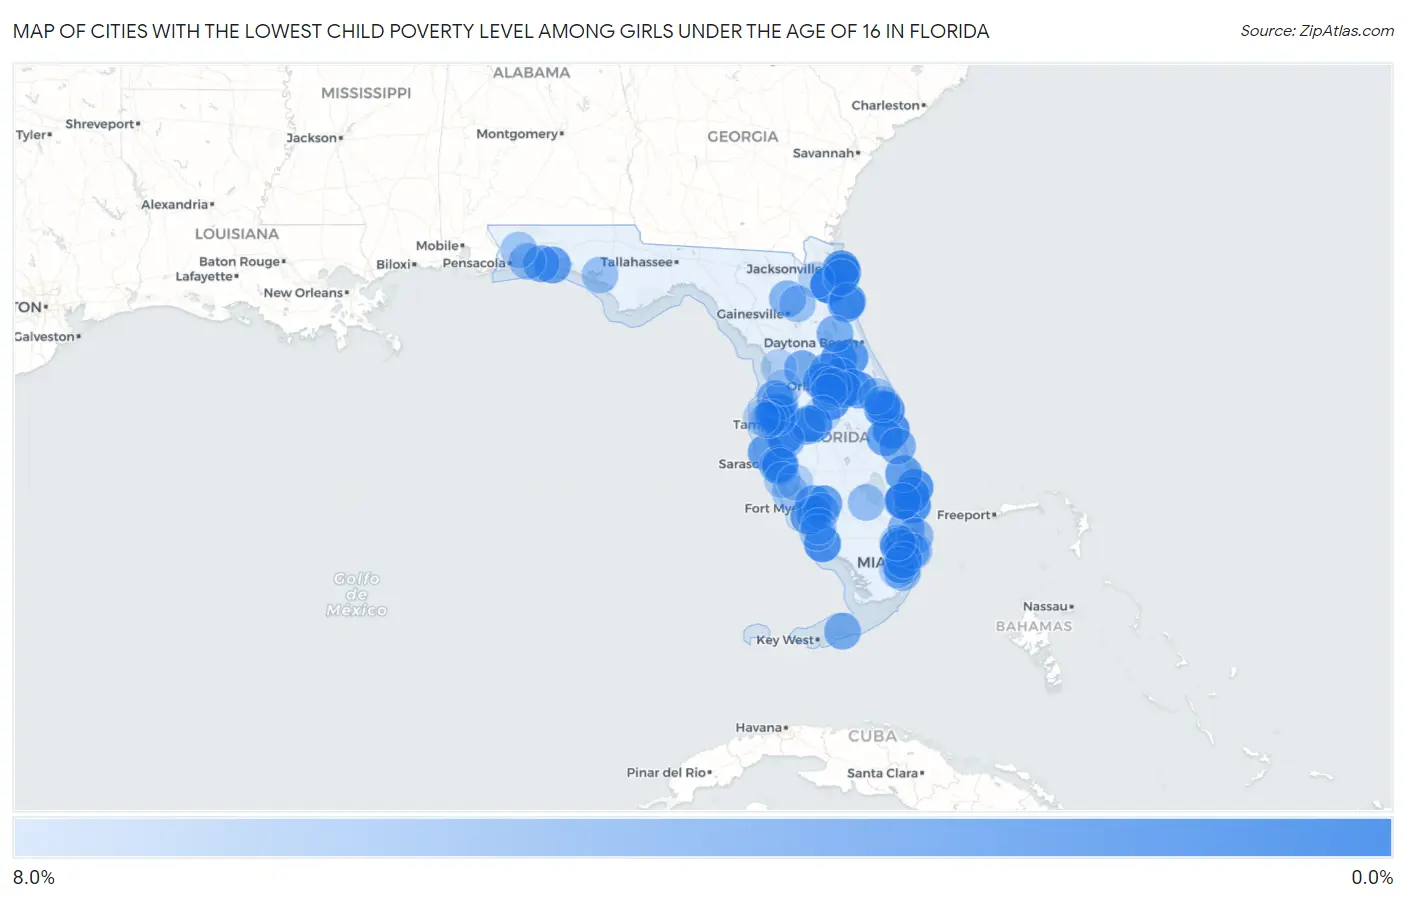
Map of Cities with the Lowest Child Poverty Level Among Girls Under the Age of 16 in Florida
8.0%
0.0%
Cities with the Lowest Child Poverty Level Among Girls Under the Age of 16 in Florida
| City | Child Poverty (Girls) | vs State | vs National | |
| 1. | Fruit Cove | 0.25% | 17.8%(-17.6)#1 | 17.0%(-16.7)#8 |
| 2. | Jacksonville Beach | 0.71% | 17.8%(-17.1)#2 | 17.0%(-16.3)#77 |
| 3. | Apollo Beach | 0.83% | 17.8%(-17.0)#3 | 17.0%(-16.2)#103 |
| 4. | Southwest Ranches | 0.90% | 17.8%(-16.9)#4 | 17.0%(-16.1)#137 |
| 5. | The Acreage | 0.94% | 17.8%(-16.9)#5 | 17.0%(-16.0)#143 |
| 6. | Micco | 1.3% | 17.8%(-16.5)#6 | 17.0%(-15.7)#267 |
| 7. | Lely Resort | 1.4% | 17.8%(-16.4)#7 | 17.0%(-15.6)#302 |
| 8. | Satellite Beach | 1.4% | 17.8%(-16.4)#8 | 17.0%(-15.6)#309 |
| 9. | Lake Belvedere Estates | 1.5% | 17.8%(-16.3)#9 | 17.0%(-15.5)#350 |
| 10. | Tequesta | 1.6% | 17.8%(-16.2)#10 | 17.0%(-15.4)#386 |
| 11. | Pine Lakes | 1.6% | 17.8%(-16.2)#11 | 17.0%(-15.4)#387 |
| 12. | Celebration | 1.6% | 17.8%(-16.2)#12 | 17.0%(-15.4)#390 |
| 13. | Northdale | 1.7% | 17.8%(-16.1)#13 | 17.0%(-15.2)#462 |
| 14. | Vero Lake Estates | 2.0% | 17.8%(-15.9)#14 | 17.0%(-15.0)#562 |
| 15. | Iona | 2.0% | 17.8%(-15.9)#15 | 17.0%(-15.0)#563 |
| 16. | Highland City | 2.0% | 17.8%(-15.8)#16 | 17.0%(-15.0)#573 |
| 17. | Windermere | 2.1% | 17.8%(-15.8)#17 | 17.0%(-14.9)#616 |
| 18. | Lake Helen | 2.1% | 17.8%(-15.7)#18 | 17.0%(-14.9)#625 |
| 19. | Palm Beach Gardens | 2.2% | 17.8%(-15.6)#19 | 17.0%(-14.8)#716 |
| 20. | Suncoast Estates | 2.3% | 17.8%(-15.5)#20 | 17.0%(-14.7)#752 |
| 21. | Fairview Shores | 2.4% | 17.8%(-15.4)#21 | 17.0%(-14.5)#834 |
| 22. | Palm Shores | 2.5% | 17.8%(-15.3)#22 | 17.0%(-14.5)#864 |
| 23. | Atlantic Beach | 2.5% | 17.8%(-15.3)#23 | 17.0%(-14.5)#878 |
| 24. | Destin | 2.5% | 17.8%(-15.3)#24 | 17.0%(-14.5)#881 |
| 25. | Wedgefield | 2.5% | 17.8%(-15.3)#25 | 17.0%(-14.5)#885 |
| 26. | Palm City | 2.5% | 17.8%(-15.3)#26 | 17.0%(-14.5)#893 |
| 27. | St Augustine Shores | 2.6% | 17.8%(-15.2)#27 | 17.0%(-14.4)#926 |
| 28. | Holmes Beach | 2.6% | 17.8%(-15.2)#28 | 17.0%(-14.4)#943 |
| 29. | Olga | 2.6% | 17.8%(-15.2)#29 | 17.0%(-14.3)#954 |
| 30. | Cheval | 2.7% | 17.8%(-15.1)#30 | 17.0%(-14.3)#1,003 |
| 31. | Southgate | 2.7% | 17.8%(-15.1)#31 | 17.0%(-14.2)#1,004 |
| 32. | Fellsmere | 2.9% | 17.8%(-15.0)#32 | 17.0%(-14.1)#1,082 |
| 33. | Fruitville | 2.9% | 17.8%(-14.9)#33 | 17.0%(-14.1)#1,090 |
| 34. | Montverde | 2.9% | 17.8%(-14.9)#34 | 17.0%(-14.1)#1,101 |
| 35. | Cooper City | 2.9% | 17.8%(-14.9)#35 | 17.0%(-14.1)#1,113 |
| 36. | Keystone | 2.9% | 17.8%(-14.9)#36 | 17.0%(-14.1)#1,122 |
| 37. | Edgewood | 3.0% | 17.8%(-14.8)#37 | 17.0%(-14.0)#1,181 |
| 38. | Glenvar Heights | 3.0% | 17.8%(-14.8)#38 | 17.0%(-14.0)#1,183 |
| 39. | Mary Esther | 3.1% | 17.8%(-14.7)#39 | 17.0%(-13.9)#1,222 |
| 40. | Quail Ridge | 3.1% | 17.8%(-14.7)#40 | 17.0%(-13.9)#1,230 |
| 41. | St Augustine Beach | 3.1% | 17.8%(-14.7)#41 | 17.0%(-13.9)#1,235 |
| 42. | Hurlburt Field | 3.1% | 17.8%(-14.7)#42 | 17.0%(-13.9)#1,238 |
| 43. | Wekiwa Springs | 3.1% | 17.8%(-14.7)#43 | 17.0%(-13.9)#1,241 |
| 44. | Rainbow Lakes Estates | 3.3% | 17.8%(-14.5)#44 | 17.0%(-13.6)#1,380 |
| 45. | Coleman | 3.4% | 17.8%(-14.4)#45 | 17.0%(-13.6)#1,407 |
| 46. | Miami Lakes | 3.5% | 17.8%(-14.3)#46 | 17.0%(-13.5)#1,501 |
| 47. | Minneola | 3.5% | 17.8%(-14.3)#47 | 17.0%(-13.4)#1,510 |
| 48. | Big Pine Key | 3.6% | 17.8%(-14.2)#48 | 17.0%(-13.4)#1,549 |
| 49. | Virginia Gardens | 3.6% | 17.8%(-14.2)#49 | 17.0%(-13.4)#1,560 |
| 50. | Seville | 3.7% | 17.8%(-14.2)#50 | 17.0%(-13.3)#1,579 |
| 51. | Tangerine | 3.8% | 17.8%(-14.0)#51 | 17.0%(-13.2)#1,664 |
| 52. | Parkland | 3.8% | 17.8%(-14.0)#52 | 17.0%(-13.2)#1,679 |
| 53. | Villas | 3.9% | 17.8%(-13.9)#53 | 17.0%(-13.1)#1,719 |
| 54. | Vero Beach South | 3.9% | 17.8%(-13.9)#54 | 17.0%(-13.1)#1,725 |
| 55. | Fuller Heights | 4.0% | 17.8%(-13.8)#55 | 17.0%(-12.9)#1,808 |
| 56. | Alafaya | 4.1% | 17.8%(-13.7)#56 | 17.0%(-12.9)#1,833 |
| 57. | Lakeland Highlands | 4.2% | 17.8%(-13.6)#57 | 17.0%(-12.8)#1,887 |
| 58. | Brooker | 4.2% | 17.8%(-13.6)#58 | 17.0%(-12.8)#1,907 |
| 59. | Belle Isle | 4.2% | 17.8%(-13.6)#59 | 17.0%(-12.7)#1,950 |
| 60. | Lutz | 4.3% | 17.8%(-13.5)#60 | 17.0%(-12.7)#1,989 |
| 61. | Gateway | 4.4% | 17.8%(-13.4)#61 | 17.0%(-12.6)#2,039 |
| 62. | Westlake | 4.5% | 17.8%(-13.3)#62 | 17.0%(-12.5)#2,112 |
| 63. | Golden Beach | 4.5% | 17.8%(-13.3)#63 | 17.0%(-12.5)#2,117 |
| 64. | Palmetto Bay | 4.6% | 17.8%(-13.2)#64 | 17.0%(-12.4)#2,180 |
| 65. | Lauderdale By The Sea | 4.6% | 17.8%(-13.2)#65 | 17.0%(-12.4)#2,183 |
| 66. | Sun City Center | 4.6% | 17.8%(-13.2)#66 | 17.0%(-12.4)#2,201 |
| 67. | Ojus | 4.6% | 17.8%(-13.2)#67 | 17.0%(-12.4)#2,207 |
| 68. | Winter Garden | 4.7% | 17.8%(-13.1)#68 | 17.0%(-12.3)#2,231 |
| 69. | Carrollwood | 4.8% | 17.8%(-13.0)#69 | 17.0%(-12.2)#2,321 |
| 70. | Harlem | 4.9% | 17.8%(-12.9)#70 | 17.0%(-12.1)#2,371 |
| 71. | Holley | 4.9% | 17.8%(-12.9)#71 | 17.0%(-12.1)#2,379 |
| 72. | Gotha | 5.0% | 17.8%(-12.8)#72 | 17.0%(-12.0)#2,425 |
| 73. | Lynn Haven | 5.1% | 17.8%(-12.7)#73 | 17.0%(-11.9)#2,528 |
| 74. | Waldo | 5.1% | 17.8%(-12.7)#74 | 17.0%(-11.8)#2,535 |
| 75. | Connerton | 5.2% | 17.8%(-12.6)#75 | 17.0%(-11.8)#2,553 |
| 76. | Bradfordville | 5.2% | 17.8%(-12.6)#76 | 17.0%(-11.8)#2,572 |
| 77. | Cocoa | 5.3% | 17.8%(-12.5)#77 | 17.0%(-11.6)#2,657 |
| 78. | Westchase | 5.4% | 17.8%(-12.4)#78 | 17.0%(-11.5)#2,699 |
| 79. | Lake Kerr | 5.5% | 17.8%(-12.3)#79 | 17.0%(-11.5)#2,732 |
| 80. | Milton | 5.6% | 17.8%(-12.2)#80 | 17.0%(-11.4)#2,777 |
| 81. | Bee Ridge | 5.6% | 17.8%(-12.2)#81 | 17.0%(-11.4)#2,787 |
| 82. | Rotonda | 5.6% | 17.8%(-12.2)#82 | 17.0%(-11.4)#2,796 |
| 83. | Naples Park | 5.7% | 17.8%(-12.1)#83 | 17.0%(-11.3)#2,822 |
| 84. | Merritt Island | 5.7% | 17.8%(-12.1)#84 | 17.0%(-11.3)#2,827 |
| 85. | Venice Gardens | 5.7% | 17.8%(-12.1)#85 | 17.0%(-11.3)#2,847 |
| 86. | Safety Harbor | 5.8% | 17.8%(-12.1)#86 | 17.0%(-11.2)#2,876 |
| 87. | The Crossings | 5.8% | 17.8%(-12.0)#87 | 17.0%(-11.2)#2,880 |
| 88. | Horizon West | 5.8% | 17.8%(-12.0)#88 | 17.0%(-11.2)#2,902 |
| 89. | Pembroke Pines | 5.8% | 17.8%(-12.0)#89 | 17.0%(-11.2)#2,914 |
| 90. | Westchester | 6.0% | 17.8%(-11.9)#90 | 17.0%(-11.0)#3,000 |
| 91. | Miami Springs | 6.0% | 17.8%(-11.8)#91 | 17.0%(-10.9)#3,040 |
| 92. | Lake Alfred | 6.1% | 17.8%(-11.7)#92 | 17.0%(-10.9)#3,072 |
| 93. | North Port | 6.1% | 17.8%(-11.7)#93 | 17.0%(-10.9)#3,092 |
| 94. | Weston | 6.2% | 17.8%(-11.6)#94 | 17.0%(-10.8)#3,139 |
| 95. | Lecanto | 6.2% | 17.8%(-11.6)#95 | 17.0%(-10.7)#3,153 |
| 96. | Oakleaf Plantation | 6.2% | 17.8%(-11.6)#96 | 17.0%(-10.7)#3,157 |
| 97. | Dunedin | 6.3% | 17.8%(-11.5)#97 | 17.0%(-10.7)#3,211 |
| 98. | South Brooksville | 6.5% | 17.8%(-11.4)#98 | 17.0%(-10.5)#3,276 |
| 99. | Bonita Springs | 6.5% | 17.8%(-11.3)#99 | 17.0%(-10.5)#3,279 |
| 100. | Palm Valley | 6.5% | 17.8%(-11.3)#100 | 17.0%(-10.5)#3,280 |
Common Questions
What are the Top 10 Cities with the Lowest Child Poverty Level Among Girls Under the Age of 16 in Florida?
Top 10 Cities with the Lowest Child Poverty Level Among Girls Under the Age of 16 in Florida are:
#1
0.25%
#2
0.71%
#3
0.83%
#4
0.90%
#5
0.94%
#6
1.3%
#7
1.4%
#8
1.4%
#9
1.5%
#10
1.6%
What city has the Lowest Child Poverty Level Among Girls Under the Age of 16 in Florida?
Fruit Cove has the Lowest Child Poverty Level Among Girls Under the Age of 16 in Florida with 0.25%.
What is the Poverty Level Among Girls Under the Age of 16 in the State of Florida?
Poverty Level Among Girls Under the Age of 16 in Florida is 17.8%.
What is the Poverty Level Among Girls Under the Age of 16 in the United States?
Poverty Level Among Girls Under the Age of 16 in the United States is 17.0%.