Cities with the Lowest Child Poverty Level Among Girls Under the Age of 16 in Colorado
RELATED REPORTS & OPTIONS
Lowest Poverty | Girls 0-16
Colorado
Compare Cities
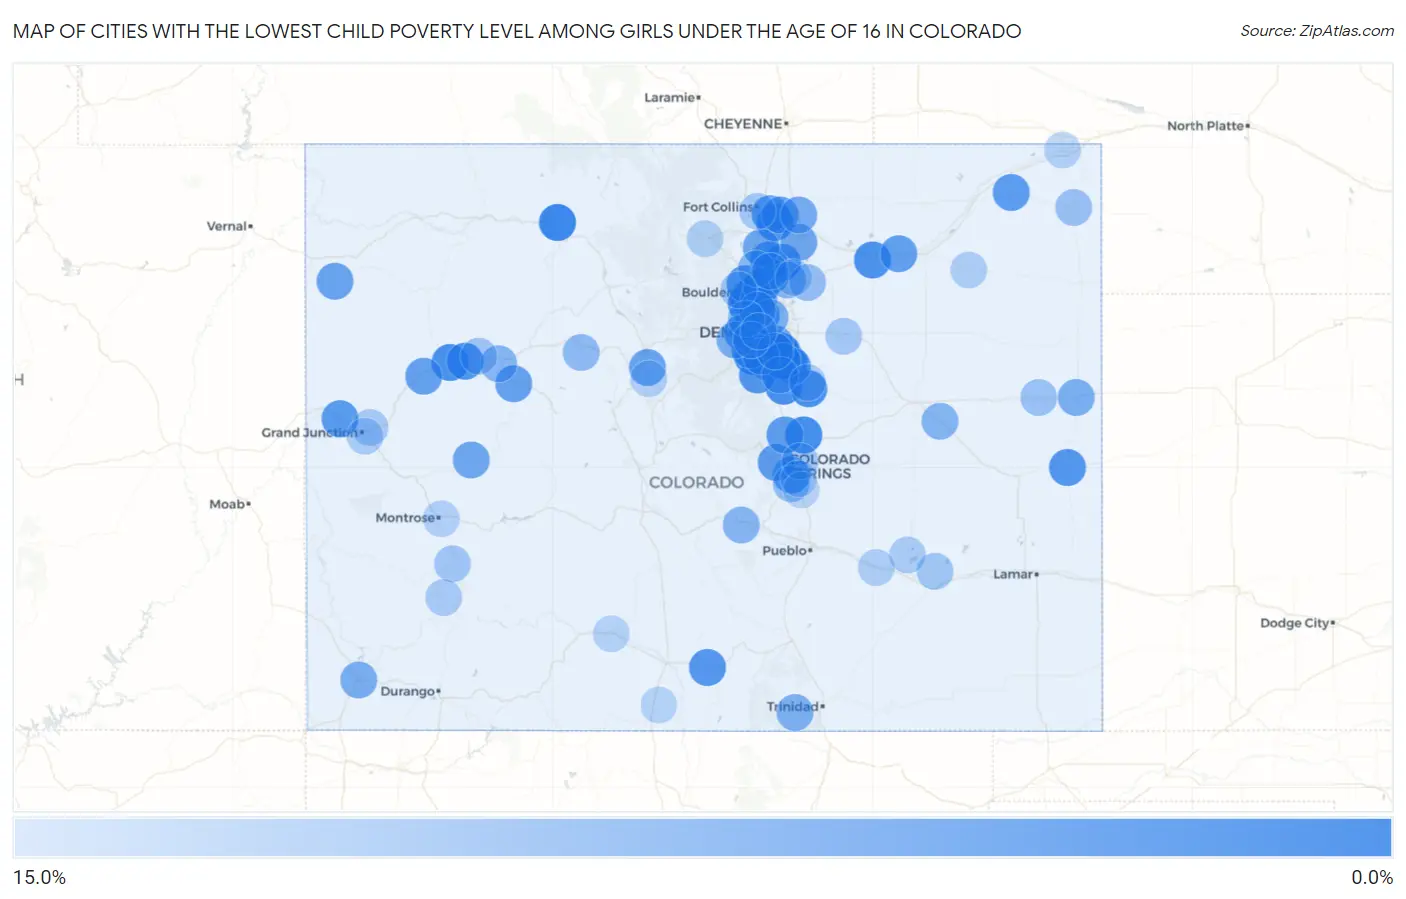
Map of Cities with the Lowest Child Poverty Level Among Girls Under the Age of 16 in Colorado
15.0%
0.0%
Cities with the Lowest Child Poverty Level Among Girls Under the Age of 16 in Colorado
| City | Child Poverty (Girls) | vs State | vs National | |
| 1. | Lone Tree | 0.20% | 11.2%(-11.0)#1 | 17.0%(-16.8)#4 |
| 2. | Steamboat Springs | 0.64% | 11.2%(-10.6)#2 | 17.0%(-16.3)#65 |
| 3. | Ken Caryl | 0.97% | 11.2%(-10.3)#3 | 17.0%(-16.0)#153 |
| 4. | Stonegate | 1.1% | 11.2%(-10.1)#4 | 17.0%(-15.8)#210 |
| 5. | Black Forest | 1.3% | 11.2%(-9.95)#5 | 17.0%(-15.7)#272 |
| 6. | Bow Mar | 1.3% | 11.2%(-9.91)#6 | 17.0%(-15.6)#292 |
| 7. | Louisville | 1.4% | 11.2%(-9.85)#7 | 17.0%(-15.6)#316 |
| 8. | Highlands Ranch | 1.4% | 11.2%(-9.81)#8 | 17.0%(-15.5)#331 |
| 9. | Castle Rock | 1.7% | 11.2%(-9.51)#9 | 17.0%(-15.2)#458 |
| 10. | Rifle | 1.7% | 11.2%(-9.51)#10 | 17.0%(-15.2)#464 |
| 11. | Lafayette | 1.7% | 11.2%(-9.50)#11 | 17.0%(-15.2)#465 |
| 12. | Windsor | 1.8% | 11.2%(-9.43)#12 | 17.0%(-15.2)#503 |
| 13. | Superior | 1.9% | 11.2%(-9.36)#13 | 17.0%(-15.1)#538 |
| 14. | Elizabeth | 1.9% | 11.2%(-9.35)#14 | 17.0%(-15.1)#542 |
| 15. | Wiggins | 2.1% | 11.2%(-9.17)#15 | 17.0%(-14.9)#638 |
| 16. | Silt | 2.3% | 11.2%(-8.99)#16 | 17.0%(-14.7)#745 |
| 17. | Golden | 2.4% | 11.2%(-8.82)#17 | 17.0%(-14.6)#832 |
| 18. | Cheyenne Wells | 2.5% | 11.2%(-8.71)#18 | 17.0%(-14.4)#909 |
| 19. | Roxborough Park | 2.6% | 11.2%(-8.64)#19 | 17.0%(-14.4)#942 |
| 20. | Shaw Heights | 2.6% | 11.2%(-8.61)#20 | 17.0%(-14.3)#955 |
| 21. | Platteville | 2.7% | 11.2%(-8.60)#21 | 17.0%(-14.3)#961 |
| 22. | Centennial | 2.7% | 11.2%(-8.51)#22 | 17.0%(-14.2)#1,016 |
| 23. | Cherry Creek | 2.7% | 11.2%(-8.51)#23 | 17.0%(-14.2)#1,017 |
| 24. | Blanca | 2.8% | 11.2%(-8.47)#24 | 17.0%(-14.2)#1,048 |
| 25. | Gunbarrel | 3.1% | 11.2%(-8.18)#25 | 17.0%(-13.9)#1,223 |
| 26. | Mead | 3.1% | 11.2%(-8.18)#26 | 17.0%(-13.9)#1,229 |
| 27. | Dakota Ridge | 3.1% | 11.2%(-8.12)#27 | 17.0%(-13.8)#1,255 |
| 28. | Parker | 3.1% | 11.2%(-8.12)#28 | 17.0%(-13.8)#1,256 |
| 29. | Fruita | 3.2% | 11.2%(-8.09)#29 | 17.0%(-13.8)#1,272 |
| 30. | Broomfield | 3.3% | 11.2%(-7.98)#30 | 17.0%(-13.7)#1,342 |
| 31. | Fleming | 3.3% | 11.2%(-7.92)#31 | 17.0%(-13.6)#1,390 |
| 32. | Stratmoor | 3.3% | 11.2%(-7.90)#32 | 17.0%(-13.6)#1,398 |
| 33. | Manitou Springs | 3.4% | 11.2%(-7.83)#33 | 17.0%(-13.6)#1,432 |
| 34. | Gleneagle | 3.4% | 11.2%(-7.82)#34 | 17.0%(-13.6)#1,438 |
| 35. | Cherry Hills Village | 3.4% | 11.2%(-7.82)#35 | 17.0%(-13.5)#1,441 |
| 36. | Sterling Ranch | 3.6% | 11.2%(-7.69)#36 | 17.0%(-13.4)#1,530 |
| 37. | Timnath | 3.6% | 11.2%(-7.67)#37 | 17.0%(-13.4)#1,548 |
| 38. | Log Lane Village | 3.8% | 11.2%(-7.48)#38 | 17.0%(-13.2)#1,641 |
| 39. | Frederick | 3.8% | 11.2%(-7.45)#39 | 17.0%(-13.2)#1,661 |
| 40. | Erie | 4.0% | 11.2%(-7.28)#40 | 17.0%(-13.0)#1,773 |
| 41. | Carbondale | 4.1% | 11.2%(-7.12)#41 | 17.0%(-12.8)#1,871 |
| 42. | Battlement Mesa | 4.3% | 11.2%(-6.97)#42 | 17.0%(-12.7)#1,980 |
| 43. | Rangely | 4.3% | 11.2%(-6.90)#43 | 17.0%(-12.6)#2,017 |
| 44. | Severance | 4.4% | 11.2%(-6.86)#44 | 17.0%(-12.6)#2,050 |
| 45. | Applewood | 4.4% | 11.2%(-6.86)#45 | 17.0%(-12.6)#2,051 |
| 46. | Breckenridge | 4.5% | 11.2%(-6.73)#46 | 17.0%(-12.5)#2,135 |
| 47. | Berthoud | 4.7% | 11.2%(-6.55)#47 | 17.0%(-12.3)#2,245 |
| 48. | Paonia | 4.9% | 11.2%(-6.31)#48 | 17.0%(-12.0)#2,411 |
| 49. | La Salle | 5.0% | 11.2%(-6.25)#49 | 17.0%(-12.0)#2,443 |
| 50. | Holly Hills | 5.4% | 11.2%(-5.84)#50 | 17.0%(-11.6)#2,683 |
| 51. | Eaton | 5.5% | 11.2%(-5.80)#51 | 17.0%(-11.5)#2,704 |
| 52. | Meridian | 5.6% | 11.2%(-5.64)#52 | 17.0%(-11.4)#2,792 |
| 53. | Littleton | 5.7% | 11.2%(-5.54)#53 | 17.0%(-11.3)#2,850 |
| 54. | Cortez | 5.9% | 11.2%(-5.35)#54 | 17.0%(-11.1)#2,980 |
| 55. | Burlington | 5.9% | 11.2%(-5.31)#55 | 17.0%(-11.0)#2,993 |
| 56. | Welby | 6.0% | 11.2%(-5.24)#56 | 17.0%(-11.0)#3,026 |
| 57. | Genesee | 6.2% | 11.2%(-5.08)#57 | 17.0%(-10.8)#3,121 |
| 58. | Castle Pines | 6.4% | 11.2%(-4.86)#58 | 17.0%(-10.6)#3,241 |
| 59. | Segundo | 6.5% | 11.2%(-4.80)#59 | 17.0%(-10.5)#3,274 |
| 60. | Hugo | 7.0% | 11.2%(-4.29)#60 | 17.0%(-10.0)#3,590 |
| 61. | Lincoln Park | 7.0% | 11.2%(-4.21)#61 | 17.0%(-9.94)#3,642 |
| 62. | Fort Lupton | 7.1% | 11.2%(-4.17)#62 | 17.0%(-9.90)#3,664 |
| 63. | Glenwood Springs | 7.1% | 11.2%(-4.13)#63 | 17.0%(-9.86)#3,685 |
| 64. | Westminster | 7.2% | 11.2%(-4.07)#64 | 17.0%(-9.79)#3,740 |
| 65. | Longmont | 7.2% | 11.2%(-4.04)#65 | 17.0%(-9.76)#3,754 |
| 66. | Arvada | 7.5% | 11.2%(-3.74)#66 | 17.0%(-9.46)#3,926 |
| 67. | Firestone | 7.5% | 11.2%(-3.70)#67 | 17.0%(-9.43)#3,933 |
| 68. | Edwards | 7.7% | 11.2%(-3.60)#68 | 17.0%(-9.32)#3,989 |
| 69. | Hudson | 8.1% | 11.2%(-3.13)#69 | 17.0%(-8.85)#4,285 |
| 70. | Fort Carson | 8.4% | 11.2%(-2.81)#70 | 17.0%(-8.54)#4,454 |
| 71. | Holyoke | 8.5% | 11.2%(-2.72)#71 | 17.0%(-8.45)#4,501 |
| 72. | Greenwood Village | 8.5% | 11.2%(-2.71)#72 | 17.0%(-8.44)#4,507 |
| 73. | Lakewood | 8.6% | 11.2%(-2.68)#73 | 17.0%(-8.41)#4,517 |
| 74. | Stratton | 8.7% | 11.2%(-2.50)#74 | 17.0%(-8.23)#4,610 |
| 75. | New Castle | 9.2% | 11.2%(-2.05)#75 | 17.0%(-7.78)#4,828 |
| 76. | Ridgway | 9.3% | 11.2%(-1.95)#76 | 17.0%(-7.67)#4,884 |
| 77. | Boulder | 9.3% | 11.2%(-1.95)#77 | 17.0%(-7.67)#4,893 |
| 78. | Edgewater | 9.4% | 11.2%(-1.86)#78 | 17.0%(-7.59)#4,936 |
| 79. | Cimarron Hills | 9.4% | 11.2%(-1.85)#79 | 17.0%(-7.58)#4,941 |
| 80. | Cheraw | 9.5% | 11.2%(-1.73)#80 | 17.0%(-7.45)#5,028 |
| 81. | Twin Lakes Cdp Adams County | 9.6% | 11.2%(-1.66)#81 | 17.0%(-7.39)#5,051 |
| 82. | Strasburg | 9.6% | 11.2%(-1.63)#82 | 17.0%(-7.36)#5,072 |
| 83. | Fort Collins | 9.6% | 11.2%(-1.62)#83 | 17.0%(-7.35)#5,074 |
| 84. | Four Square Mile | 10.0% | 11.2%(-1.21)#84 | 17.0%(-6.93)#5,292 |
| 85. | Ponderosa Park | 10.1% | 11.2%(-1.18)#85 | 17.0%(-6.90)#5,304 |
| 86. | Telluride | 10.1% | 11.2%(-1.17)#86 | 17.0%(-6.90)#5,305 |
| 87. | Fruitvale | 10.1% | 11.2%(-1.17)#87 | 17.0%(-6.89)#5,308 |
| 88. | Orchard Mesa | 10.2% | 11.2%(-1.04)#88 | 17.0%(-6.76)#5,373 |
| 89. | Aristocrat Ranchettes | 10.2% | 11.2%(-1.03)#89 | 17.0%(-6.75)#5,377 |
| 90. | Ordway | 10.2% | 11.2%(-1.00)#90 | 17.0%(-6.73)#5,388 |
| 91. | Fowler | 10.4% | 11.2%(-0.833)#91 | 17.0%(-6.56)#5,488 |
| 92. | Akron | 10.4% | 11.2%(-0.815)#92 | 17.0%(-6.54)#5,503 |
| 93. | Estes Park | 10.6% | 11.2%(-0.635)#93 | 17.0%(-6.36)#5,605 |
| 94. | Montrose | 10.7% | 11.2%(-0.547)#94 | 17.0%(-6.27)#5,656 |
| 95. | Ovid | 10.7% | 11.2%(-0.535)#95 | 17.0%(-6.26)#5,675 |
| 96. | Blue River | 10.7% | 11.2%(-0.506)#96 | 17.0%(-6.23)#5,684 |
| 97. | Manassa | 10.9% | 11.2%(-0.359)#97 | 17.0%(-6.09)#5,736 |
| 98. | Del Norte | 11.0% | 11.2%(-0.291)#98 | 17.0%(-6.02)#5,760 |
| 99. | Fountain | 11.1% | 11.2%(-0.168)#99 | 17.0%(-5.89)#5,800 |
| 100. | Security Widefield | 11.1% | 11.2%(-0.136)#100 | 17.0%(-5.86)#5,874 |
Common Questions
What are the Top 10 Cities with the Lowest Child Poverty Level Among Girls Under the Age of 16 in Colorado?
Top 10 Cities with the Lowest Child Poverty Level Among Girls Under the Age of 16 in Colorado are:
#1
0.20%
#2
0.64%
#3
0.97%
#4
1.1%
#5
1.3%
#6
1.3%
#7
1.4%
#8
1.4%
#9
1.7%
#10
1.7%
What city has the Lowest Child Poverty Level Among Girls Under the Age of 16 in Colorado?
Lone Tree has the Lowest Child Poverty Level Among Girls Under the Age of 16 in Colorado with 0.20%.
What is the Poverty Level Among Girls Under the Age of 16 in the State of Colorado?
Poverty Level Among Girls Under the Age of 16 in Colorado is 11.2%.
What is the Poverty Level Among Girls Under the Age of 16 in the United States?
Poverty Level Among Girls Under the Age of 16 in the United States is 17.0%.