Cities with the Lowest Child Poverty Level Among Girls Under the Age of 16 in Minnesota
RELATED REPORTS & OPTIONS
Lowest Poverty | Girls 0-16
Minnesota
Compare Cities
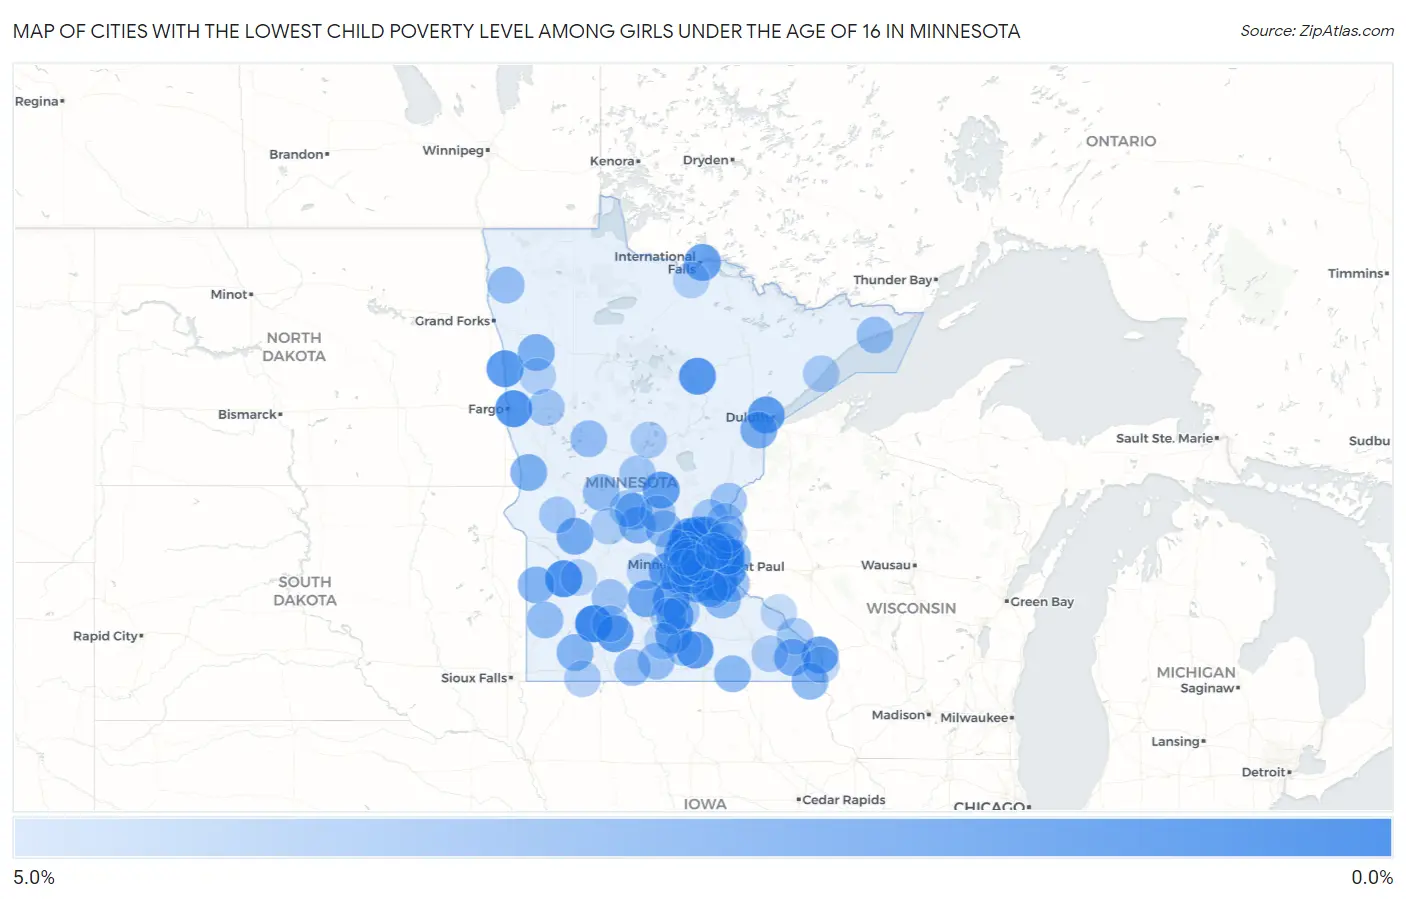
Map of Cities with the Lowest Child Poverty Level Among Girls Under the Age of 16 in Minnesota
5.0%
0.0%
Cities with the Lowest Child Poverty Level Among Girls Under the Age of 16 in Minnesota
| City | Child Poverty (Girls) | vs State | vs National | |
| 1. | Otsego | 0.61% | 11.3%(-10.6)#1 | 17.0%(-16.4)#61 |
| 2. | Lamberton | 0.76% | 11.3%(-10.5)#2 | 17.0%(-16.2)#92 |
| 3. | Rosemount | 1.1% | 11.3%(-10.2)#3 | 17.0%(-15.9)#201 |
| 4. | Mahtomedi | 1.3% | 11.3%(-9.98)#4 | 17.0%(-15.7)#261 |
| 5. | Clarkfield | 1.4% | 11.3%(-9.90)#5 | 17.0%(-15.6)#295 |
| 6. | Shorewood | 1.4% | 11.3%(-9.84)#6 | 17.0%(-15.6)#321 |
| 7. | Dilworth | 1.5% | 11.3%(-9.78)#7 | 17.0%(-15.5)#343 |
| 8. | Dayton | 1.6% | 11.3%(-9.64)#8 | 17.0%(-15.4)#395 |
| 9. | Greenfield | 1.6% | 11.3%(-9.61)#9 | 17.0%(-15.3)#411 |
| 10. | Coleraine | 1.7% | 11.3%(-9.56)#10 | 17.0%(-15.3)#439 |
| 11. | Halstad | 1.8% | 11.3%(-9.50)#11 | 17.0%(-15.2)#469 |
| 12. | Prior Lake | 1.8% | 11.3%(-9.49)#12 | 17.0%(-15.2)#475 |
| 13. | Waconia | 1.9% | 11.3%(-9.40)#13 | 17.0%(-15.1)#518 |
| 14. | Hermantown | 1.9% | 11.3%(-9.33)#14 | 17.0%(-15.0)#557 |
| 15. | New Richland | 1.9% | 11.3%(-9.31)#15 | 17.0%(-15.0)#560 |
| 16. | Ramsey | 2.0% | 11.3%(-9.24)#16 | 17.0%(-15.0)#599 |
| 17. | Buckman | 2.0% | 11.3%(-9.21)#17 | 17.0%(-14.9)#611 |
| 18. | Comfrey | 2.1% | 11.3%(-9.17)#18 | 17.0%(-14.9)#640 |
| 19. | Nowthen | 2.2% | 11.3%(-9.10)#19 | 17.0%(-14.8)#681 |
| 20. | Oak Grove | 2.2% | 11.3%(-9.03)#20 | 17.0%(-14.8)#718 |
| 21. | La Crescent | 2.2% | 11.3%(-9.03)#21 | 17.0%(-14.8)#719 |
| 22. | St Clair | 2.2% | 11.3%(-9.03)#22 | 17.0%(-14.8)#724 |
| 23. | Henderson | 2.2% | 11.3%(-9.02)#23 | 17.0%(-14.7)#729 |
| 24. | Ranier | 2.3% | 11.3%(-8.98)#24 | 17.0%(-14.7)#756 |
| 25. | Wayzata | 2.3% | 11.3%(-8.98)#25 | 17.0%(-14.7)#762 |
| 26. | North Oaks | 2.3% | 11.3%(-8.91)#26 | 17.0%(-14.6)#789 |
| 27. | Elk River | 2.5% | 11.3%(-8.79)#27 | 17.0%(-14.5)#863 |
| 28. | Woodbury | 2.5% | 11.3%(-8.79)#28 | 17.0%(-14.5)#868 |
| 29. | New Germany | 2.5% | 11.3%(-8.76)#29 | 17.0%(-14.5)#882 |
| 30. | Winthrop | 2.5% | 11.3%(-8.73)#30 | 17.0%(-14.5)#897 |
| 31. | Cleveland | 2.5% | 11.3%(-8.71)#31 | 17.0%(-14.4)#910 |
| 32. | Dellwood | 2.6% | 11.3%(-8.69)#32 | 17.0%(-14.4)#921 |
| 33. | Chanhassen | 2.7% | 11.3%(-8.60)#33 | 17.0%(-14.3)#964 |
| 34. | Benson | 2.7% | 11.3%(-8.55)#34 | 17.0%(-14.3)#990 |
| 35. | Hanover | 2.7% | 11.3%(-8.52)#35 | 17.0%(-14.2)#1,009 |
| 36. | Rushford Village | 2.8% | 11.3%(-8.48)#36 | 17.0%(-14.2)#1,039 |
| 37. | Wrenshall | 2.8% | 11.3%(-8.48)#37 | 17.0%(-14.2)#1,047 |
| 38. | Albany | 2.9% | 11.3%(-8.33)#38 | 17.0%(-14.0)#1,130 |
| 39. | Fertile | 3.0% | 11.3%(-8.22)#39 | 17.0%(-13.9)#1,194 |
| 40. | Campbell | 3.0% | 11.3%(-8.22)#40 | 17.0%(-13.9)#1,200 |
| 41. | Deephaven | 3.1% | 11.3%(-8.19)#41 | 17.0%(-13.9)#1,217 |
| 42. | Corcoran | 3.1% | 11.3%(-8.17)#42 | 17.0%(-13.9)#1,237 |
| 43. | Canby | 3.3% | 11.3%(-8.00)#43 | 17.0%(-13.7)#1,331 |
| 44. | Stillwater | 3.3% | 11.3%(-7.99)#44 | 17.0%(-13.7)#1,344 |
| 45. | Richmond | 3.3% | 11.3%(-7.98)#45 | 17.0%(-13.7)#1,349 |
| 46. | Arden Hills | 3.3% | 11.3%(-7.96)#46 | 17.0%(-13.7)#1,361 |
| 47. | Fulda | 3.3% | 11.3%(-7.94)#47 | 17.0%(-13.7)#1,377 |
| 48. | Eitzen | 3.4% | 11.3%(-7.87)#48 | 17.0%(-13.6)#1,421 |
| 49. | Randolph | 3.5% | 11.3%(-7.75)#49 | 17.0%(-13.5)#1,495 |
| 50. | Rose Creek | 3.5% | 11.3%(-7.73)#50 | 17.0%(-13.4)#1,509 |
| 51. | Medina | 3.6% | 11.3%(-7.68)#51 | 17.0%(-13.4)#1,538 |
| 52. | Lino Lakes | 3.6% | 11.3%(-7.62)#52 | 17.0%(-13.3)#1,569 |
| 53. | Clearwater | 3.7% | 11.3%(-7.60)#53 | 17.0%(-13.3)#1,582 |
| 54. | Farmington | 3.7% | 11.3%(-7.51)#54 | 17.0%(-13.2)#1,625 |
| 55. | Tyler | 3.7% | 11.3%(-7.51)#55 | 17.0%(-13.2)#1,630 |
| 56. | Osakis | 3.8% | 11.3%(-7.49)#56 | 17.0%(-13.2)#1,636 |
| 57. | Winnebago | 3.8% | 11.3%(-7.46)#57 | 17.0%(-13.2)#1,659 |
| 58. | Edina | 3.8% | 11.3%(-7.44)#58 | 17.0%(-13.2)#1,669 |
| 59. | New York Mills | 3.8% | 11.3%(-7.44)#59 | 17.0%(-13.2)#1,673 |
| 60. | Grand Marais | 3.9% | 11.3%(-7.37)#60 | 17.0%(-13.1)#1,720 |
| 61. | Argyle | 3.9% | 11.3%(-7.36)#61 | 17.0%(-13.1)#1,733 |
| 62. | Hastings | 3.9% | 11.3%(-7.35)#62 | 17.0%(-13.1)#1,734 |
| 63. | Welcome | 4.0% | 11.3%(-7.26)#63 | 17.0%(-13.0)#1,788 |
| 64. | Chaska | 4.0% | 11.3%(-7.24)#64 | 17.0%(-13.0)#1,801 |
| 65. | Minnetonka | 4.0% | 11.3%(-7.24)#65 | 17.0%(-13.0)#1,802 |
| 66. | Rock Creek | 4.1% | 11.3%(-7.15)#66 | 17.0%(-12.9)#1,858 |
| 67. | Morton | 4.2% | 11.3%(-7.09)#67 | 17.0%(-12.8)#1,902 |
| 68. | Waldorf | 4.2% | 11.3%(-7.09)#68 | 17.0%(-12.8)#1,908 |
| 69. | Springfield | 4.2% | 11.3%(-7.06)#69 | 17.0%(-12.8)#1,916 |
| 70. | Lake Park | 4.2% | 11.3%(-7.03)#70 | 17.0%(-12.8)#1,938 |
| 71. | Morris | 4.2% | 11.3%(-7.02)#71 | 17.0%(-12.7)#1,943 |
| 72. | Randall | 4.3% | 11.3%(-7.00)#72 | 17.0%(-12.7)#1,964 |
| 73. | Le Center | 4.3% | 11.3%(-6.99)#73 | 17.0%(-12.7)#1,968 |
| 74. | Sauk Rapids | 4.3% | 11.3%(-6.98)#74 | 17.0%(-12.7)#1,977 |
| 75. | Cambridge | 4.3% | 11.3%(-6.98)#75 | 17.0%(-12.7)#1,979 |
| 76. | Grant | 4.3% | 11.3%(-6.94)#76 | 17.0%(-12.7)#1,992 |
| 77. | Goodview | 4.3% | 11.3%(-6.94)#77 | 17.0%(-12.7)#1,993 |
| 78. | North Branch | 4.4% | 11.3%(-6.84)#78 | 17.0%(-12.6)#2,065 |
| 79. | Lakeville | 4.4% | 11.3%(-6.82)#79 | 17.0%(-12.5)#2,074 |
| 80. | Freeport | 4.4% | 11.3%(-6.81)#80 | 17.0%(-12.5)#2,085 |
| 81. | Buffalo | 4.5% | 11.3%(-6.77)#81 | 17.0%(-12.5)#2,119 |
| 82. | Silver Bay | 4.5% | 11.3%(-6.74)#82 | 17.0%(-12.5)#2,133 |
| 83. | Round Lake | 4.5% | 11.3%(-6.71)#83 | 17.0%(-12.4)#2,157 |
| 84. | Chatfield | 4.6% | 11.3%(-6.69)#84 | 17.0%(-12.4)#2,169 |
| 85. | Nisswa | 4.6% | 11.3%(-6.66)#85 | 17.0%(-12.4)#2,187 |
| 86. | Belgrade | 4.6% | 11.3%(-6.63)#86 | 17.0%(-12.3)#2,211 |
| 87. | Mound | 4.7% | 11.3%(-6.58)#87 | 17.0%(-12.3)#2,234 |
| 88. | Chisago City | 4.7% | 11.3%(-6.55)#88 | 17.0%(-12.3)#2,252 |
| 89. | Forest Lake | 4.7% | 11.3%(-6.52)#89 | 17.0%(-12.2)#2,271 |
| 90. | Twin Valley | 4.8% | 11.3%(-6.49)#90 | 17.0%(-12.2)#2,284 |
| 91. | Littlefork | 4.8% | 11.3%(-6.49)#91 | 17.0%(-12.2)#2,287 |
| 92. | Brownsville | 4.8% | 11.3%(-6.42)#92 | 17.0%(-12.1)#2,338 |
| 93. | Medicine Lake | 4.9% | 11.3%(-6.38)#93 | 17.0%(-12.1)#2,366 |
| 94. | Hutchinson | 4.9% | 11.3%(-6.37)#94 | 17.0%(-12.1)#2,370 |
| 95. | Granite Falls | 4.9% | 11.3%(-6.37)#95 | 17.0%(-12.1)#2,373 |
| 96. | Loretto | 4.9% | 11.3%(-6.35)#96 | 17.0%(-12.1)#2,380 |
| 97. | Lexington | 4.9% | 11.3%(-6.31)#97 | 17.0%(-12.0)#2,415 |
| 98. | St Peter | 5.0% | 11.3%(-6.30)#98 | 17.0%(-12.0)#2,420 |
| 99. | Wabasha | 5.0% | 11.3%(-6.26)#99 | 17.0%(-12.0)#2,444 |
| 100. | Good Thunder | 5.0% | 11.3%(-6.26)#100 | 17.0%(-12.0)#2,452 |
Common Questions
What are the Top 10 Cities with the Lowest Child Poverty Level Among Girls Under the Age of 16 in Minnesota?
Top 10 Cities with the Lowest Child Poverty Level Among Girls Under the Age of 16 in Minnesota are:
#1
0.61%
#2
0.76%
#3
1.1%
#4
1.3%
#5
1.4%
#6
1.4%
#7
1.5%
#8
1.6%
#9
1.6%
#10
1.7%
What city has the Lowest Child Poverty Level Among Girls Under the Age of 16 in Minnesota?
Otsego has the Lowest Child Poverty Level Among Girls Under the Age of 16 in Minnesota with 0.61%.
What is the Poverty Level Among Girls Under the Age of 16 in the State of Minnesota?
Poverty Level Among Girls Under the Age of 16 in Minnesota is 11.3%.
What is the Poverty Level Among Girls Under the Age of 16 in the United States?
Poverty Level Among Girls Under the Age of 16 in the United States is 17.0%.