Cities with the Lowest Child Poverty Level Among Girls Under the Age of 16 in Massachusetts
RELATED REPORTS & OPTIONS
Lowest Poverty | Girls 0-16
Massachusetts
Compare Cities
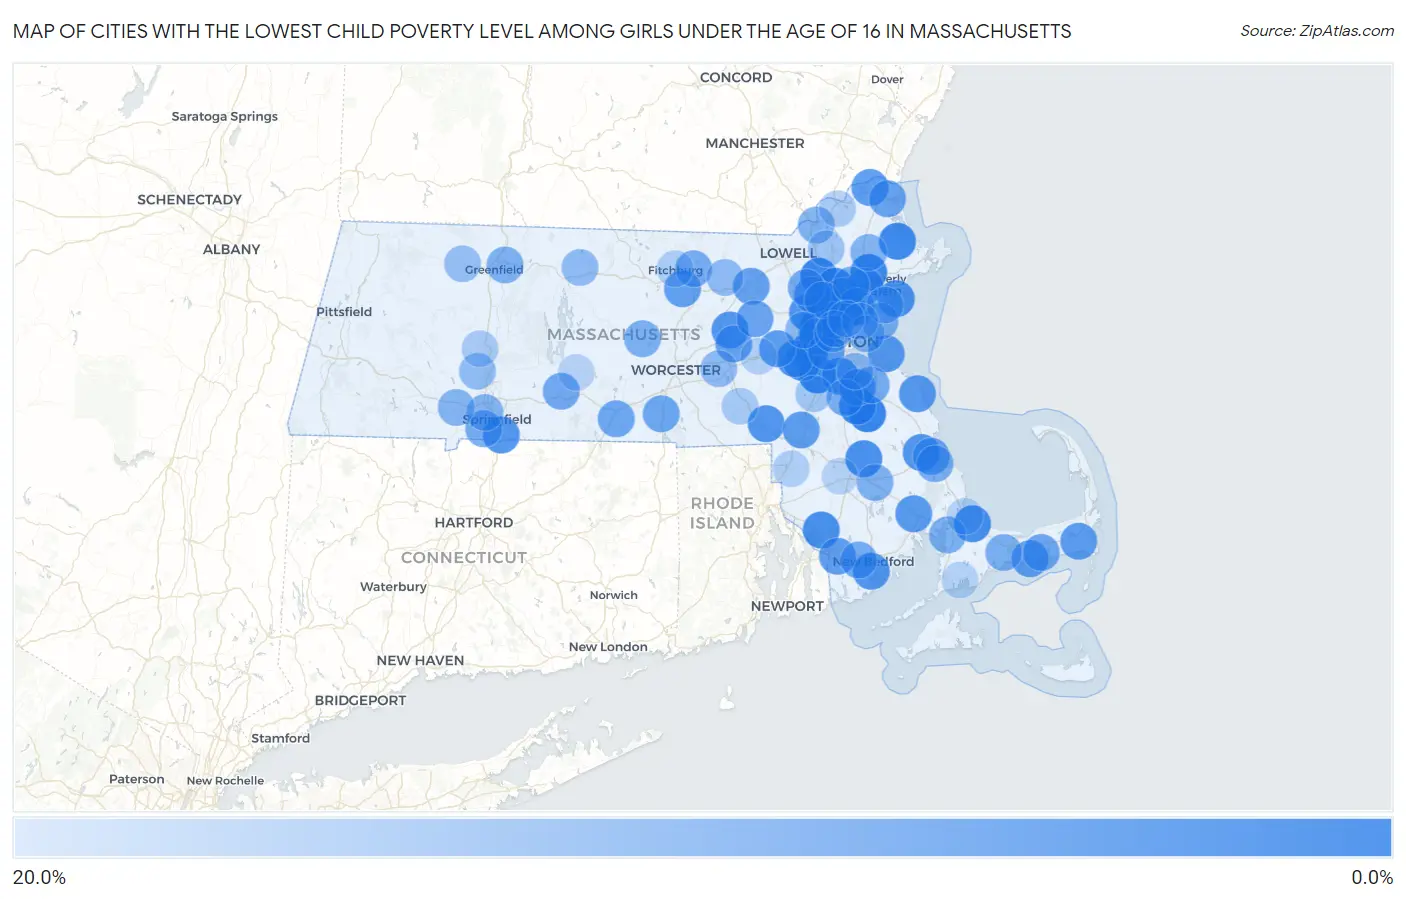
Map of Cities with the Lowest Child Poverty Level Among Girls Under the Age of 16 in Massachusetts
20.0%
0.0%
Cities with the Lowest Child Poverty Level Among Girls Under the Age of 16 in Massachusetts
| City | Child Poverty (Girls) | vs State | vs National | |
| 1. | Melrose | 0.18% | 11.8%(-11.6)#1 | 17.0%(-16.8)#3 |
| 2. | Abington | 0.29% | 11.8%(-11.5)#2 | 17.0%(-16.7)#12 |
| 3. | Winchester | 0.31% | 11.8%(-11.5)#3 | 17.0%(-16.7)#14 |
| 4. | Dedham | 0.56% | 11.8%(-11.3)#4 | 17.0%(-16.4)#53 |
| 5. | Wilmington | 0.76% | 11.8%(-11.1)#5 | 17.0%(-16.2)#91 |
| 6. | Danvers | 1.0% | 11.8%(-10.8)#6 | 17.0%(-16.0)#167 |
| 7. | Arlington | 1.1% | 11.8%(-10.7)#7 | 17.0%(-15.9)#203 |
| 8. | Holbrook | 1.1% | 11.8%(-10.7)#8 | 17.0%(-15.8)#212 |
| 9. | Ipswich | 1.2% | 11.8%(-10.6)#9 | 17.0%(-15.8)#230 |
| 10. | Newton | 1.7% | 11.8%(-10.1)#10 | 17.0%(-15.2)#457 |
| 11. | Reading | 1.9% | 11.8%(-9.95)#11 | 17.0%(-15.1)#532 |
| 12. | Sandwich | 2.3% | 11.8%(-9.57)#12 | 17.0%(-14.7)#741 |
| 13. | Milton | 2.5% | 11.8%(-9.37)#13 | 17.0%(-14.5)#857 |
| 14. | Bridgewater Town | 2.5% | 11.8%(-9.31)#14 | 17.0%(-14.5)#894 |
| 15. | Marblehead | 2.5% | 11.8%(-9.30)#15 | 17.0%(-14.5)#900 |
| 16. | Belmont | 2.7% | 11.8%(-9.12)#16 | 17.0%(-14.3)#1,001 |
| 17. | Somerset | 2.7% | 11.8%(-9.09)#17 | 17.0%(-14.2)#1,008 |
| 18. | Needham | 2.9% | 11.8%(-8.97)#18 | 17.0%(-14.1)#1,080 |
| 19. | Lexington | 3.2% | 11.8%(-8.62)#19 | 17.0%(-13.8)#1,289 |
| 20. | Franklin Town | 3.5% | 11.8%(-8.32)#20 | 17.0%(-13.5)#1,490 |
| 21. | Wellesley | 3.5% | 11.8%(-8.31)#21 | 17.0%(-13.5)#1,498 |
| 22. | Kingston | 3.5% | 11.8%(-8.29)#22 | 17.0%(-13.4)#1,513 |
| 23. | Longmeadow | 3.7% | 11.8%(-8.10)#23 | 17.0%(-13.2)#1,616 |
| 24. | Hudson | 3.7% | 11.8%(-8.09)#24 | 17.0%(-13.2)#1,618 |
| 25. | Stoneham | 3.7% | 11.8%(-8.08)#25 | 17.0%(-13.2)#1,623 |
| 26. | Bliss Corner | 3.9% | 11.8%(-7.91)#26 | 17.0%(-13.1)#1,740 |
| 27. | Braintree Town | 4.2% | 11.8%(-7.60)#27 | 17.0%(-12.8)#1,933 |
| 28. | Watertown Town | 4.3% | 11.8%(-7.48)#28 | 17.0%(-12.6)#2,008 |
| 29. | Hull | 4.3% | 11.8%(-7.48)#29 | 17.0%(-12.6)#2,009 |
| 30. | Scituate | 4.4% | 11.8%(-7.43)#30 | 17.0%(-12.6)#2,052 |
| 31. | Brookline | 4.7% | 11.8%(-7.13)#31 | 17.0%(-12.3)#2,246 |
| 32. | West Wareham | 4.7% | 11.8%(-7.11)#32 | 17.0%(-12.3)#2,261 |
| 33. | Wakefield | 4.9% | 11.8%(-6.89)#33 | 17.0%(-12.0)#2,409 |
| 34. | Cochituate | 5.0% | 11.8%(-6.83)#34 | 17.0%(-12.0)#2,439 |
| 35. | East Harwich | 5.1% | 11.8%(-6.77)#35 | 17.0%(-11.9)#2,490 |
| 36. | Amesbury Town | 5.1% | 11.8%(-6.68)#36 | 17.0%(-11.8)#2,542 |
| 37. | West Yarmouth | 5.2% | 11.8%(-6.63)#37 | 17.0%(-11.8)#2,575 |
| 38. | Foxborough | 5.4% | 11.8%(-6.46)#38 | 17.0%(-11.6)#2,664 |
| 39. | North Westport | 5.7% | 11.8%(-6.14)#39 | 17.0%(-11.3)#2,831 |
| 40. | Leominster | 5.8% | 11.8%(-6.00)#40 | 17.0%(-11.1)#2,917 |
| 41. | Medford | 6.1% | 11.8%(-5.76)#41 | 17.0%(-10.9)#3,067 |
| 42. | Peabody | 6.1% | 11.8%(-5.71)#42 | 17.0%(-10.9)#3,090 |
| 43. | Saugus | 6.2% | 11.8%(-5.62)#43 | 17.0%(-10.8)#3,137 |
| 44. | North Attleborough | 6.4% | 11.8%(-5.44)#44 | 17.0%(-10.6)#3,232 |
| 45. | Marlborough | 6.5% | 11.8%(-5.30)#45 | 17.0%(-10.5)#3,312 |
| 46. | Littleton Common | 6.5% | 11.8%(-5.30)#46 | 17.0%(-10.5)#3,313 |
| 47. | Maynard | 6.7% | 11.8%(-5.08)#47 | 17.0%(-10.2)#3,467 |
| 48. | North Plymouth | 6.8% | 11.8%(-5.06)#48 | 17.0%(-10.2)#3,482 |
| 49. | Newburyport | 6.8% | 11.8%(-5.03)#49 | 17.0%(-10.2)#3,503 |
| 50. | Burlington | 6.8% | 11.8%(-4.99)#50 | 17.0%(-10.1)#3,520 |
| 51. | Sturbridge | 7.1% | 11.8%(-4.68)#51 | 17.0%(-9.83)#3,693 |
| 52. | Oxford | 7.2% | 11.8%(-4.59)#52 | 17.0%(-9.74)#3,765 |
| 53. | South Yarmouth | 7.5% | 11.8%(-4.31)#53 | 17.0%(-9.46)#3,928 |
| 54. | Palmer Town | 7.8% | 11.8%(-4.06)#54 | 17.0%(-9.21)#4,080 |
| 55. | Pinehurst | 8.5% | 11.8%(-3.34)#55 | 17.0%(-8.49)#4,482 |
| 56. | Smith Mills | 8.5% | 11.8%(-3.29)#56 | 17.0%(-8.44)#4,508 |
| 57. | Lunenburg | 8.6% | 11.8%(-3.25)#57 | 17.0%(-8.40)#4,521 |
| 58. | Woburn | 8.6% | 11.8%(-3.24)#58 | 17.0%(-8.39)#4,532 |
| 59. | Amherst | 8.6% | 11.8%(-3.22)#59 | 17.0%(-8.37)#4,538 |
| 60. | Weymouth Town | 8.6% | 11.8%(-3.22)#60 | 17.0%(-8.37)#4,541 |
| 61. | Agawam Town | 8.7% | 11.8%(-3.14)#61 | 17.0%(-8.29)#4,575 |
| 62. | Randolph Town | 8.8% | 11.8%(-2.99)#62 | 17.0%(-8.14)#4,655 |
| 63. | Plymouth | 9.1% | 11.8%(-2.77)#63 | 17.0%(-7.92)#4,750 |
| 64. | Nahant | 9.2% | 11.8%(-2.60)#64 | 17.0%(-7.75)#4,841 |
| 65. | Barnstable Town | 9.3% | 11.8%(-2.55)#65 | 17.0%(-7.70)#4,871 |
| 66. | Lynnfield | 9.3% | 11.8%(-2.54)#66 | 17.0%(-7.69)#4,873 |
| 67. | Winthrop Town | 9.4% | 11.8%(-2.40)#67 | 17.0%(-7.55)#4,964 |
| 68. | Rutland | 9.6% | 11.8%(-2.25)#68 | 17.0%(-7.40)#5,048 |
| 69. | Monument Beach | 9.6% | 11.8%(-2.21)#69 | 17.0%(-7.36)#5,061 |
| 70. | Turners Falls | 9.8% | 11.8%(-2.05)#70 | 17.0%(-7.20)#5,151 |
| 71. | Middleborough Center | 9.8% | 11.8%(-1.98)#71 | 17.0%(-7.13)#5,188 |
| 72. | Methuen Town | 9.9% | 11.8%(-1.91)#72 | 17.0%(-7.06)#5,217 |
| 73. | West Springfield Town | 10.3% | 11.8%(-1.51)#73 | 17.0%(-6.66)#5,420 |
| 74. | Topsfield | 10.4% | 11.8%(-1.42)#74 | 17.0%(-6.57)#5,486 |
| 75. | Swampscott | 10.6% | 11.8%(-1.20)#75 | 17.0%(-6.35)#5,608 |
| 76. | Westfield | 10.7% | 11.8%(-1.17)#76 | 17.0%(-6.32)#5,634 |
| 77. | Waltham | 11.4% | 11.8%(-0.464)#77 | 17.0%(-5.61)#5,971 |
| 78. | Cambridge | 11.9% | 11.8%(+0.031)#78 | 17.0%(-5.12)#6,199 |
| 79. | Athol | 12.1% | 11.8%(+0.237)#79 | 17.0%(-4.91)#6,298 |
| 80. | Westborough | 12.1% | 11.8%(+0.287)#80 | 17.0%(-4.86)#6,316 |
| 81. | Quincy | 12.1% | 11.8%(+0.314)#81 | 17.0%(-4.84)#6,337 |
| 82. | Ayer | 12.2% | 11.8%(+0.401)#82 | 17.0%(-4.75)#6,379 |
| 83. | Easthampton Town | 12.4% | 11.8%(+0.610)#83 | 17.0%(-4.54)#6,471 |
| 84. | Somerville | 13.0% | 11.8%(+1.13)#84 | 17.0%(-4.02)#6,752 |
| 85. | Shelburne Falls | 13.1% | 11.8%(+1.25)#85 | 17.0%(-3.90)#6,808 |
| 86. | Greenfield | 13.6% | 11.8%(+1.74)#86 | 17.0%(-3.41)#7,034 |
| 87. | Andover | 13.7% | 11.8%(+1.84)#87 | 17.0%(-3.31)#7,090 |
| 88. | Revere | 14.3% | 11.8%(+2.50)#88 | 17.0%(-2.65)#7,422 |
| 89. | Malden | 14.3% | 11.8%(+2.50)#89 | 17.0%(-2.65)#7,423 |
| 90. | Norwood | 14.6% | 11.8%(+2.79)#90 | 17.0%(-2.36)#7,533 |
| 91. | Milford | 15.3% | 11.8%(+3.50)#91 | 17.0%(-1.65)#7,863 |
| 92. | Northampton | 15.5% | 11.8%(+3.63)#92 | 17.0%(-1.52)#7,945 |
| 93. | Haverhill | 15.6% | 11.8%(+3.78)#93 | 17.0%(-1.37)#8,010 |
| 94. | Fitchburg | 16.1% | 11.8%(+4.31)#94 | 17.0%(-0.844)#8,250 |
| 95. | Attleboro | 16.5% | 11.8%(+4.66)#95 | 17.0%(-0.492)#8,383 |
| 96. | Framingham | 16.7% | 11.8%(+4.89)#96 | 17.0%(-0.255)#8,517 |
| 97. | East Falmouth | 16.9% | 11.8%(+5.10)#97 | 17.0%(-0.048)#8,584 |
| 98. | Sagamore | 17.1% | 11.8%(+5.32)#98 | 17.0%(+0.167)#8,681 |
| 99. | Taunton | 17.1% | 11.8%(+5.32)#99 | 17.0%(+0.173)#8,692 |
| 100. | Ware | 17.2% | 11.8%(+5.38)#100 | 17.0%(+0.228)#8,708 |
Common Questions
What are the Top 10 Cities with the Lowest Child Poverty Level Among Girls Under the Age of 16 in Massachusetts?
Top 10 Cities with the Lowest Child Poverty Level Among Girls Under the Age of 16 in Massachusetts are:
#1
0.18%
#2
0.29%
#3
0.31%
#4
0.56%
#5
0.76%
#6
1.0%
#7
1.1%
#8
1.1%
#9
1.2%
#10
1.7%
What city has the Lowest Child Poverty Level Among Girls Under the Age of 16 in Massachusetts?
Melrose has the Lowest Child Poverty Level Among Girls Under the Age of 16 in Massachusetts with 0.18%.
What is the Poverty Level Among Girls Under the Age of 16 in the State of Massachusetts?
Poverty Level Among Girls Under the Age of 16 in Massachusetts is 11.8%.
What is the Poverty Level Among Girls Under the Age of 16 in the United States?
Poverty Level Among Girls Under the Age of 16 in the United States is 17.0%.