Cities with the Lowest Child Poverty Level Among Girls Under the Age of 16 in Nebraska
RELATED REPORTS & OPTIONS
Lowest Poverty | Girls 0-16
Nebraska
Compare Cities
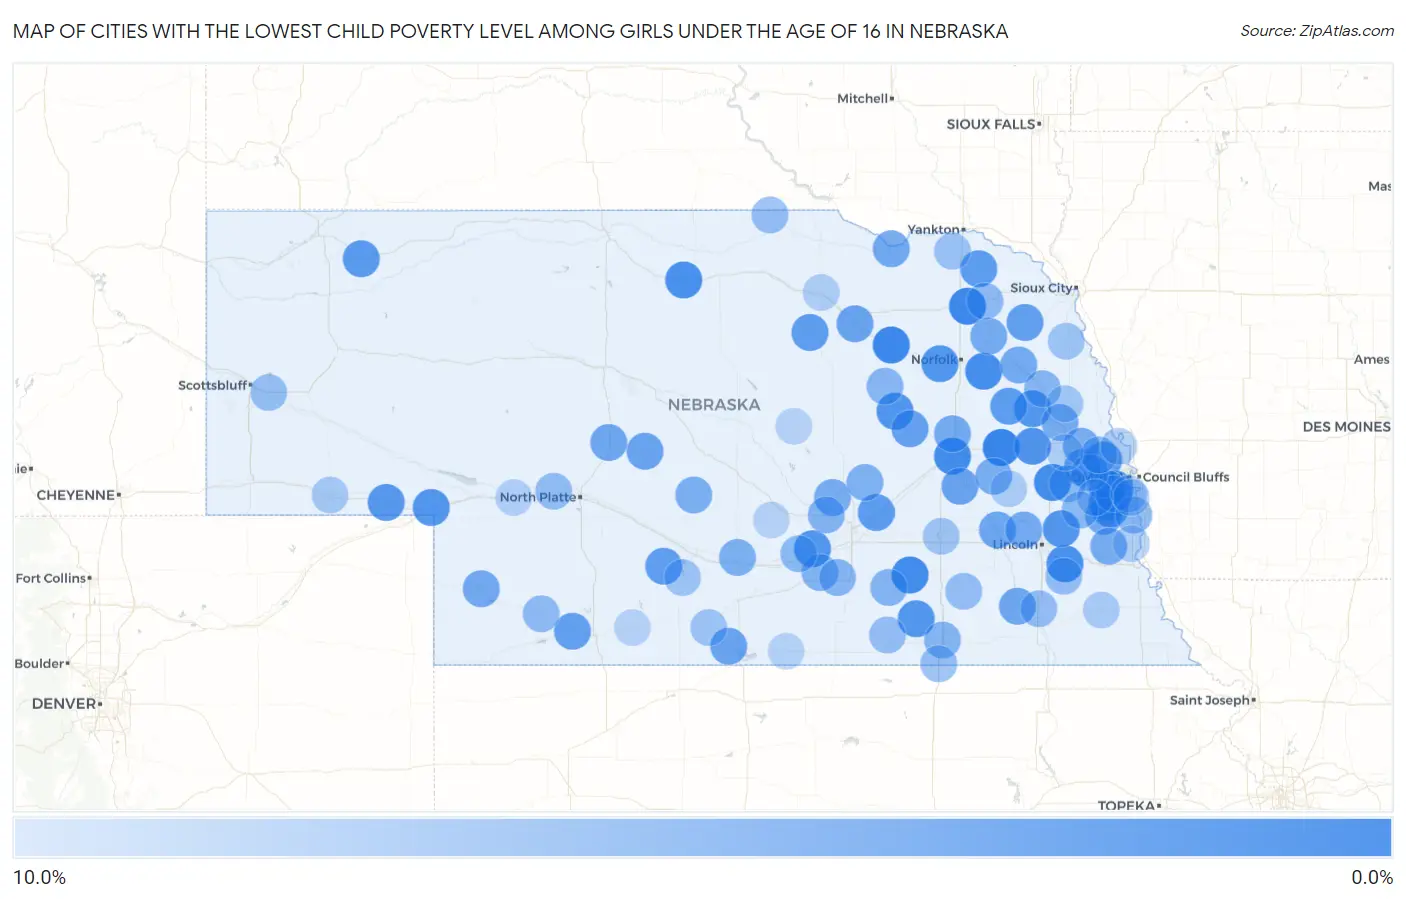
Map of Cities with the Lowest Child Poverty Level Among Girls Under the Age of 16 in Nebraska
10.0%
0.0%
Cities with the Lowest Child Poverty Level Among Girls Under the Age of 16 in Nebraska
| City | Child Poverty (Girls) | vs State | vs National | |
| 1. | Schuyler | 0.39% | 12.1%(-11.7)#1 | 17.0%(-16.6)#27 |
| 2. | Neligh | 0.62% | 12.1%(-11.5)#2 | 17.0%(-16.4)#62 |
| 3. | Randolph | 0.68% | 12.1%(-11.4)#3 | 17.0%(-16.3)#73 |
| 4. | Wahoo | 1.1% | 12.1%(-11.0)#4 | 17.0%(-15.9)#192 |
| 5. | Sutton | 1.1% | 12.1%(-11.0)#5 | 17.0%(-15.8)#209 |
| 6. | Duncan | 1.2% | 12.1%(-10.9)#6 | 17.0%(-15.8)#241 |
| 7. | Stanton | 1.3% | 12.1%(-10.8)#7 | 17.0%(-15.7)#276 |
| 8. | Bennet | 1.6% | 12.1%(-10.5)#8 | 17.0%(-15.4)#398 |
| 9. | Ainsworth | 1.7% | 12.1%(-10.4)#9 | 17.0%(-15.3)#431 |
| 10. | Springfield | 2.0% | 12.1%(-10.1)#10 | 17.0%(-15.0)#584 |
| 11. | North Bend | 2.1% | 12.1%(-10.0)#11 | 17.0%(-14.9)#626 |
| 12. | Albion | 2.2% | 12.1%(-9.88)#12 | 17.0%(-14.8)#711 |
| 13. | Shelton | 2.2% | 12.1%(-9.87)#13 | 17.0%(-14.8)#720 |
| 14. | Battle Creek | 2.3% | 12.1%(-9.79)#14 | 17.0%(-14.7)#769 |
| 15. | Waverly | 2.4% | 12.1%(-9.66)#15 | 17.0%(-14.5)#837 |
| 16. | Big Springs | 2.4% | 12.1%(-9.65)#16 | 17.0%(-14.5)#843 |
| 17. | Davenport | 2.4% | 12.1%(-9.65)#17 | 17.0%(-14.5)#850 |
| 18. | Snyder | 2.4% | 12.1%(-9.65)#18 | 17.0%(-14.5)#851 |
| 19. | Chappell | 2.6% | 12.1%(-9.49)#19 | 17.0%(-14.4)#936 |
| 20. | Hay Springs | 2.8% | 12.1%(-9.31)#20 | 17.0%(-14.2)#1,040 |
| 21. | Cedar Creek | 2.9% | 12.1%(-9.23)#21 | 17.0%(-14.1)#1,088 |
| 22. | Hartington | 2.9% | 12.1%(-9.15)#22 | 17.0%(-14.0)#1,136 |
| 23. | Howells | 2.9% | 12.1%(-9.15)#23 | 17.0%(-14.0)#1,142 |
| 24. | Chapman | 2.9% | 12.1%(-9.15)#24 | 17.0%(-14.0)#1,149 |
| 25. | Bennington | 3.0% | 12.1%(-9.13)#25 | 17.0%(-14.0)#1,159 |
| 26. | Chambers | 3.1% | 12.1%(-8.97)#26 | 17.0%(-13.9)#1,252 |
| 27. | Eustis | 3.2% | 12.1%(-8.86)#27 | 17.0%(-13.8)#1,309 |
| 28. | La Vista | 3.3% | 12.1%(-8.83)#28 | 17.0%(-13.7)#1,336 |
| 29. | Chalco | 3.3% | 12.1%(-8.78)#29 | 17.0%(-13.7)#1,372 |
| 30. | Culbertson | 3.4% | 12.1%(-8.72)#30 | 17.0%(-13.6)#1,408 |
| 31. | Wakefield | 3.5% | 12.1%(-8.60)#31 | 17.0%(-13.5)#1,477 |
| 32. | St Edward | 3.8% | 12.1%(-8.32)#32 | 17.0%(-13.2)#1,642 |
| 33. | Shelby | 3.8% | 12.1%(-8.24)#33 | 17.0%(-13.1)#1,694 |
| 34. | Ewing | 3.8% | 12.1%(-8.24)#34 | 17.0%(-13.1)#1,701 |
| 35. | Orleans | 3.9% | 12.1%(-8.17)#35 | 17.0%(-13.1)#1,749 |
| 36. | Arnold | 3.9% | 12.1%(-8.15)#36 | 17.0%(-13.0)#1,757 |
| 37. | Valley | 4.0% | 12.1%(-8.12)#37 | 17.0%(-13.0)#1,771 |
| 38. | Seward | 4.2% | 12.1%(-7.87)#38 | 17.0%(-12.8)#1,932 |
| 39. | De Witt | 4.3% | 12.1%(-7.74)#39 | 17.0%(-12.6)#2,022 |
| 40. | Stapleton | 4.3% | 12.1%(-7.74)#40 | 17.0%(-12.6)#2,025 |
| 41. | Niobrara | 4.4% | 12.1%(-7.65)#41 | 17.0%(-12.5)#2,091 |
| 42. | Imperial | 4.6% | 12.1%(-7.53)#42 | 17.0%(-12.4)#2,166 |
| 43. | Louisville | 4.7% | 12.1%(-7.40)#43 | 17.0%(-12.3)#2,238 |
| 44. | Platte Center | 4.7% | 12.1%(-7.40)#44 | 17.0%(-12.3)#2,241 |
| 45. | Malcolm | 4.8% | 12.1%(-7.33)#45 | 17.0%(-12.2)#2,292 |
| 46. | Winside | 4.8% | 12.1%(-7.28)#46 | 17.0%(-12.2)#2,315 |
| 47. | Wisner | 4.8% | 12.1%(-7.25)#47 | 17.0%(-12.1)#2,332 |
| 48. | Hooper | 4.9% | 12.1%(-7.15)#48 | 17.0%(-12.0)#2,412 |
| 49. | Dannebrog | 5.0% | 12.1%(-7.09)#49 | 17.0%(-12.0)#2,461 |
| 50. | Avoca | 5.0% | 12.1%(-7.09)#50 | 17.0%(-12.0)#2,462 |
| 51. | Arlington | 5.0% | 12.1%(-7.07)#51 | 17.0%(-12.0)#2,475 |
| 52. | David City | 5.1% | 12.1%(-7.01)#52 | 17.0%(-11.9)#2,501 |
| 53. | Papillion | 5.2% | 12.1%(-6.88)#53 | 17.0%(-11.8)#2,577 |
| 54. | Oconto | 5.3% | 12.1%(-6.83)#54 | 17.0%(-11.7)#2,625 |
| 55. | Waterloo | 5.3% | 12.1%(-6.79)#55 | 17.0%(-11.7)#2,636 |
| 56. | Elm Creek | 5.4% | 12.1%(-6.71)#56 | 17.0%(-11.6)#2,674 |
| 57. | Palmer | 5.6% | 12.1%(-6.53)#57 | 17.0%(-11.4)#2,766 |
| 58. | Kenesaw | 5.7% | 12.1%(-6.34)#58 | 17.0%(-11.2)#2,874 |
| 59. | Clay Center | 5.8% | 12.1%(-6.28)#59 | 17.0%(-11.2)#2,911 |
| 60. | Cairo | 5.9% | 12.1%(-6.24)#60 | 17.0%(-11.1)#2,931 |
| 61. | Hebron | 6.0% | 12.1%(-6.10)#61 | 17.0%(-11.0)#3,017 |
| 62. | Petersburg | 6.1% | 12.1%(-5.99)#62 | 17.0%(-10.9)#3,074 |
| 63. | West Point | 6.2% | 12.1%(-5.89)#63 | 17.0%(-10.8)#3,134 |
| 64. | Plattsmouth | 6.2% | 12.1%(-5.88)#64 | 17.0%(-10.8)#3,140 |
| 65. | Juniata | 6.2% | 12.1%(-5.84)#65 | 17.0%(-10.7)#3,169 |
| 66. | Mead | 6.4% | 12.1%(-5.71)#66 | 17.0%(-10.6)#3,236 |
| 67. | Gibbon | 6.4% | 12.1%(-5.68)#67 | 17.0%(-10.6)#3,247 |
| 68. | Ashland | 6.4% | 12.1%(-5.66)#68 | 17.0%(-10.5)#3,255 |
| 69. | Palisade | 6.7% | 12.1%(-5.42)#69 | 17.0%(-10.3)#3,404 |
| 70. | Washington | 6.7% | 12.1%(-5.42)#70 | 17.0%(-10.3)#3,414 |
| 71. | Belden | 6.7% | 12.1%(-5.42)#71 | 17.0%(-10.3)#3,424 |
| 72. | Hershey | 6.9% | 12.1%(-5.19)#72 | 17.0%(-10.1)#3,557 |
| 73. | Panama | 6.9% | 12.1%(-5.19)#73 | 17.0%(-10.1)#3,566 |
| 74. | Nelson | 7.1% | 12.1%(-4.95)#74 | 17.0%(-9.83)#3,712 |
| 75. | Milligan | 7.1% | 12.1%(-4.95)#75 | 17.0%(-9.83)#3,719 |
| 76. | Chester | 7.1% | 12.1%(-4.95)#76 | 17.0%(-9.83)#3,722 |
| 77. | Pickrell | 7.1% | 12.1%(-4.95)#77 | 17.0%(-9.83)#3,723 |
| 78. | Naper | 7.1% | 12.1%(-4.95)#78 | 17.0%(-9.83)#3,727 |
| 79. | Minatare | 7.2% | 12.1%(-4.84)#79 | 17.0%(-9.73)#3,774 |
| 80. | Crofton | 7.5% | 12.1%(-4.59)#80 | 17.0%(-9.48)#3,916 |
| 81. | Walthill | 7.7% | 12.1%(-4.40)#81 | 17.0%(-9.28)#4,012 |
| 82. | Oxford | 7.7% | 12.1%(-4.40)#82 | 17.0%(-9.28)#4,013 |
| 83. | Elwood | 7.7% | 12.1%(-4.40)#83 | 17.0%(-9.28)#4,023 |
| 84. | Gretna | 7.8% | 12.1%(-4.26)#84 | 17.0%(-9.14)#4,116 |
| 85. | York | 7.8% | 12.1%(-4.25)#85 | 17.0%(-9.14)#4,118 |
| 86. | Uehling | 8.1% | 12.1%(-3.98)#86 | 17.0%(-8.87)#4,279 |
| 87. | Bellevue | 8.3% | 12.1%(-3.80)#87 | 17.0%(-8.68)#4,367 |
| 88. | Sidney | 8.4% | 12.1%(-3.72)#88 | 17.0%(-8.61)#4,425 |
| 89. | Tecumseh | 8.6% | 12.1%(-3.54)#89 | 17.0%(-8.42)#4,512 |
| 90. | Brainard | 8.7% | 12.1%(-3.39)#90 | 17.0%(-8.28)#4,591 |
| 91. | Fort Calhoun | 8.8% | 12.1%(-3.29)#91 | 17.0%(-8.18)#4,640 |
| 92. | Offutt Afb | 8.9% | 12.1%(-3.16)#92 | 17.0%(-8.05)#4,690 |
| 93. | O Neill | 9.0% | 12.1%(-3.12)#93 | 17.0%(-8.01)#4,708 |
| 94. | Union | 9.1% | 12.1%(-3.00)#94 | 17.0%(-7.89)#4,791 |
| 95. | Inglewood | 9.2% | 12.1%(-2.88)#95 | 17.0%(-7.77)#4,834 |
| 96. | Paxton | 9.3% | 12.1%(-2.83)#96 | 17.0%(-7.72)#4,857 |
| 97. | Franklin | 9.3% | 12.1%(-2.79)#97 | 17.0%(-7.67)#4,885 |
| 98. | Ord | 9.5% | 12.1%(-2.59)#98 | 17.0%(-7.48)#4,998 |
| 99. | Pleasanton | 9.5% | 12.1%(-2.57)#99 | 17.0%(-7.45)#5,017 |
| 100. | Bartley | 9.5% | 12.1%(-2.57)#100 | 17.0%(-7.45)#5,018 |
Common Questions
What are the Top 10 Cities with the Lowest Child Poverty Level Among Girls Under the Age of 16 in Nebraska?
Top 10 Cities with the Lowest Child Poverty Level Among Girls Under the Age of 16 in Nebraska are:
What city has the Lowest Child Poverty Level Among Girls Under the Age of 16 in Nebraska?
Schuyler has the Lowest Child Poverty Level Among Girls Under the Age of 16 in Nebraska with 0.39%.
What is the Poverty Level Among Girls Under the Age of 16 in the State of Nebraska?
Poverty Level Among Girls Under the Age of 16 in Nebraska is 12.1%.
What is the Poverty Level Among Girls Under the Age of 16 in the United States?
Poverty Level Among Girls Under the Age of 16 in the United States is 17.0%.