Cities with the Largest Jamaican Community in Pennsylvania
RELATED REPORTS & OPTIONS
Jamaican
Pennsylvania
Compare Cities
Map of Cities with the Largest Jamaican Community in Pennsylvania
0
15,000
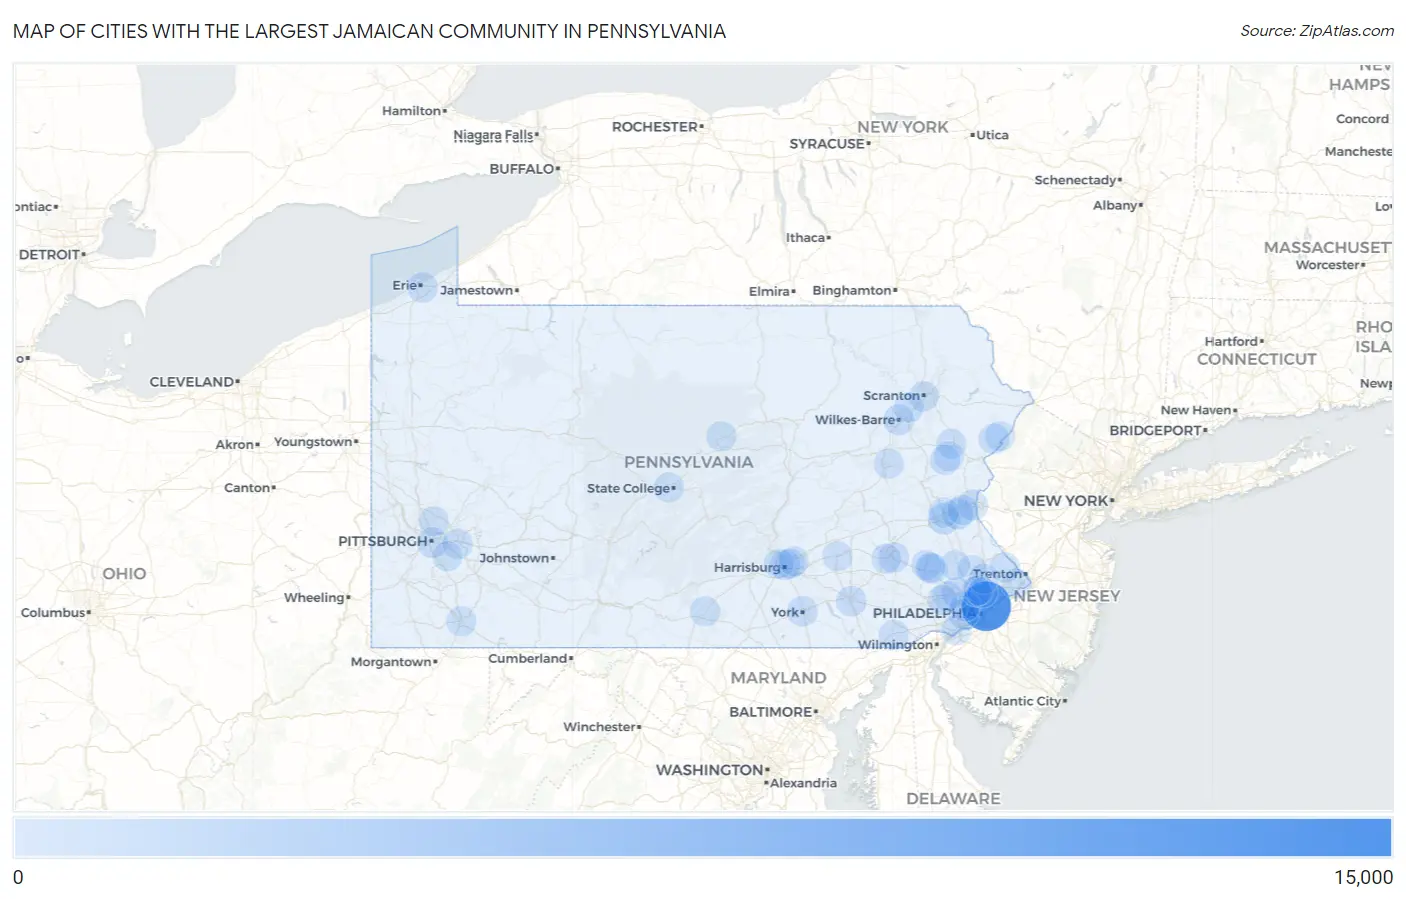
Cities with the Largest Jamaican Community in Pennsylvania
| City | Jamaican | vs State | vs National | |
| 1. | Philadelphia | 13,723 | 38,585(35.57%)#1 | 1,203,841(1.14%)#4 |
| 2. | Norristown Borough | 1,045 | 38,585(2.71%)#2 | 1,203,841(0.09%)#139 |
| 3. | Allentown | 896 | 38,585(2.32%)#3 | 1,203,841(0.07%)#165 |
| 4. | Bethlehem | 885 | 38,585(2.29%)#4 | 1,203,841(0.07%)#170 |
| 5. | Easton | 579 | 38,585(1.50%)#5 | 1,203,841(0.05%)#245 |
| 6. | Pittsburgh | 484 | 38,585(1.25%)#6 | 1,203,841(0.04%)#294 |
| 7. | Wilkes Barre | 441 | 38,585(1.14%)#7 | 1,203,841(0.04%)#312 |
| 8. | Yeadon Borough | 391 | 38,585(1.01%)#8 | 1,203,841(0.03%)#348 |
| 9. | Chambersburg Borough | 386 | 38,585(1.00%)#9 | 1,203,841(0.03%)#353 |
| 10. | Reading | 363 | 38,585(0.94%)#10 | 1,203,841(0.03%)#377 |
| 11. | Lancaster | 316 | 38,585(0.82%)#11 | 1,203,841(0.03%)#425 |
| 12. | Harrisburg | 270 | 38,585(0.70%)#12 | 1,203,841(0.02%)#487 |
| 13. | Erie | 264 | 38,585(0.68%)#13 | 1,203,841(0.02%)#502 |
| 14. | York | 255 | 38,585(0.66%)#14 | 1,203,841(0.02%)#516 |
| 15. | Saw Creek | 255 | 38,585(0.66%)#15 | 1,203,841(0.02%)#518 |
| 16. | Lansdale Borough | 248 | 38,585(0.64%)#16 | 1,203,841(0.02%)#536 |
| 17. | Morrisville Borough | 241 | 38,585(0.62%)#17 | 1,203,841(0.02%)#549 |
| 18. | State College Borough | 219 | 38,585(0.57%)#18 | 1,203,841(0.02%)#593 |
| 19. | King Of Prussia | 213 | 38,585(0.55%)#19 | 1,203,841(0.02%)#604 |
| 20. | Roslyn | 213 | 38,585(0.55%)#20 | 1,203,841(0.02%)#605 |
| 21. | Darby Borough | 210 | 38,585(0.54%)#21 | 1,203,841(0.02%)#611 |
| 22. | Drexel Hill | 204 | 38,585(0.53%)#22 | 1,203,841(0.02%)#630 |
| 23. | Scranton | 182 | 38,585(0.47%)#23 | 1,203,841(0.02%)#695 |
| 24. | Monroeville | 159 | 38,585(0.41%)#24 | 1,203,841(0.01%)#780 |
| 25. | Chester | 154 | 38,585(0.40%)#25 | 1,203,841(0.01%)#794 |
| 26. | Sanatoga | 148 | 38,585(0.38%)#26 | 1,203,841(0.01%)#829 |
| 27. | Carlisle Borough | 134 | 38,585(0.35%)#27 | 1,203,841(0.01%)#885 |
| 28. | East Petersburg Borough | 133 | 38,585(0.34%)#28 | 1,203,841(0.01%)#901 |
| 29. | Collingdale Borough | 132 | 38,585(0.34%)#29 | 1,203,841(0.01%)#910 |
| 30. | West Hazleton Borough | 127 | 38,585(0.33%)#30 | 1,203,841(0.01%)#932 |
| 31. | East Stroudsburg Borough | 119 | 38,585(0.31%)#31 | 1,203,841(0.01%)#973 |
| 32. | Sharon Hill Borough | 119 | 38,585(0.31%)#32 | 1,203,841(0.01%)#974 |
| 33. | Baldwin Borough | 113 | 38,585(0.29%)#33 | 1,203,841(0.01%)#1,021 |
| 34. | Lincoln University | 111 | 38,585(0.29%)#34 | 1,203,841(0.01%)#1,043 |
| 35. | East Lansdowne Borough | 108 | 38,585(0.28%)#35 | 1,203,841(0.01%)#1,055 |
| 36. | Lansdowne Borough | 107 | 38,585(0.28%)#36 | 1,203,841(0.01%)#1,064 |
| 37. | Aldan Borough | 103 | 38,585(0.27%)#37 | 1,203,841(0.01%)#1,097 |
| 38. | Chestnut Hill | 98 | 38,585(0.25%)#38 | 1,203,841(0.01%)#1,139 |
| 39. | Fullerton | 96 | 38,585(0.25%)#39 | 1,203,841(0.01%)#1,160 |
| 40. | West Chester Borough | 92 | 38,585(0.24%)#40 | 1,203,841(0.01%)#1,192 |
| 41. | Middletown | 90 | 38,585(0.23%)#41 | 1,203,841(0.01%)#1,214 |
| 42. | Montgomeryville | 89 | 38,585(0.23%)#42 | 1,203,841(0.01%)#1,228 |
| 43. | Carnegie Borough | 85 | 38,585(0.22%)#43 | 1,203,841(0.01%)#1,270 |
| 44. | Emerald Lakes | 85 | 38,585(0.22%)#44 | 1,203,841(0.01%)#1,273 |
| 45. | Pottstown Borough | 84 | 38,585(0.22%)#45 | 1,203,841(0.01%)#1,277 |
| 46. | Chesterbrook | 83 | 38,585(0.22%)#46 | 1,203,841(0.01%)#1,302 |
| 47. | Quakertown Borough | 80 | 38,585(0.21%)#47 | 1,203,841(0.01%)#1,323 |
| 48. | Mckeesport | 78 | 38,585(0.20%)#48 | 1,203,841(0.01%)#1,342 |
| 49. | Coaldale Borough Schuylkill County | 78 | 38,585(0.20%)#49 | 1,203,841(0.01%)#1,349 |
| 50. | Marcus Hook Borough | 78 | 38,585(0.20%)#50 | 1,203,841(0.01%)#1,350 |
| 51. | Ardmore | 75 | 38,585(0.19%)#51 | 1,203,841(0.01%)#1,368 |
| 52. | Levittown | 73 | 38,585(0.19%)#52 | 1,203,841(0.01%)#1,382 |
| 53. | Pleasant Hills Borough | 73 | 38,585(0.19%)#53 | 1,203,841(0.01%)#1,391 |
| 54. | Uniontown | 70 | 38,585(0.18%)#54 | 1,203,841(0.01%)#1,434 |
| 55. | Sun Valley | 70 | 38,585(0.18%)#55 | 1,203,841(0.01%)#1,437 |
| 56. | Whitehall Borough | 69 | 38,585(0.18%)#56 | 1,203,841(0.01%)#1,443 |
| 57. | Hayti | 69 | 38,585(0.18%)#57 | 1,203,841(0.01%)#1,450 |
| 58. | Millersville Borough | 64 | 38,585(0.17%)#58 | 1,203,841(0.01%)#1,515 |
| 59. | Laureldale Borough | 58 | 38,585(0.15%)#59 | 1,203,841(0.00%)#1,615 |
| 60. | Horsham | 57 | 38,585(0.15%)#60 | 1,203,841(0.00%)#1,626 |
| 61. | Kittanning Borough | 57 | 38,585(0.15%)#61 | 1,203,841(0.00%)#1,635 |
| 62. | Glenolden Borough | 56 | 38,585(0.15%)#62 | 1,203,841(0.00%)#1,649 |
| 63. | Oreland | 56 | 38,585(0.15%)#63 | 1,203,841(0.00%)#1,651 |
| 64. | Sierra View | 56 | 38,585(0.15%)#64 | 1,203,841(0.00%)#1,652 |
| 65. | Masontown Borough | 54 | 38,585(0.14%)#65 | 1,203,841(0.00%)#1,687 |
| 66. | Hazleton | 53 | 38,585(0.14%)#66 | 1,203,841(0.00%)#1,694 |
| 67. | Canonsburg Borough | 52 | 38,585(0.13%)#67 | 1,203,841(0.00%)#1,715 |
| 68. | Souderton Borough | 52 | 38,585(0.13%)#68 | 1,203,841(0.00%)#1,719 |
| 69. | Clifton Heights Borough | 52 | 38,585(0.13%)#69 | 1,203,841(0.00%)#1,720 |
| 70. | Mount Penn Borough | 52 | 38,585(0.13%)#70 | 1,203,841(0.00%)#1,726 |
| 71. | Pine Ridge | 52 | 38,585(0.13%)#71 | 1,203,841(0.00%)#1,727 |
| 72. | Mckinley | 52 | 38,585(0.13%)#72 | 1,203,841(0.00%)#1,728 |
| 73. | Bellefonte Borough | 51 | 38,585(0.13%)#73 | 1,203,841(0.00%)#1,744 |
| 74. | Progress | 49 | 38,585(0.13%)#74 | 1,203,841(0.00%)#1,774 |
| 75. | Wyomissing Borough | 47 | 38,585(0.12%)#75 | 1,203,841(0.00%)#1,813 |
| 76. | Enola | 47 | 38,585(0.12%)#76 | 1,203,841(0.00%)#1,816 |
| 77. | Middletown Borough | 45 | 38,585(0.12%)#77 | 1,203,841(0.00%)#1,859 |
| 78. | Flourtown | 45 | 38,585(0.12%)#78 | 1,203,841(0.00%)#1,866 |
| 79. | Blakely Borough | 44 | 38,585(0.11%)#79 | 1,203,841(0.00%)#1,887 |
| 80. | Allison Park | 41 | 38,585(0.11%)#80 | 1,203,841(0.00%)#1,944 |
| 81. | Newtown Grant | 41 | 38,585(0.11%)#81 | 1,203,841(0.00%)#1,954 |
| 82. | Harleysville | 40 | 38,585(0.10%)#82 | 1,203,841(0.00%)#1,979 |
| 83. | Pittston | 40 | 38,585(0.10%)#83 | 1,203,841(0.00%)#1,980 |
| 84. | Ridley Park Borough | 40 | 38,585(0.10%)#84 | 1,203,841(0.00%)#1,981 |
| 85. | Halfway House | 39 | 38,585(0.10%)#85 | 1,203,841(0.00%)#2,005 |
| 86. | Colonial Park | 37 | 38,585(0.10%)#86 | 1,203,841(0.00%)#2,042 |
| 87. | Stroudsburg Borough | 37 | 38,585(0.10%)#87 | 1,203,841(0.00%)#2,053 |
| 88. | Park Forest Village | 35 | 38,585(0.09%)#88 | 1,203,841(0.00%)#2,108 |
| 89. | Wyncote | 35 | 38,585(0.09%)#89 | 1,203,841(0.00%)#2,113 |
| 90. | Lebanon | 34 | 38,585(0.09%)#90 | 1,203,841(0.00%)#2,123 |
| 91. | Wilson Borough | 34 | 38,585(0.09%)#91 | 1,203,841(0.00%)#2,133 |
| 92. | Pottsgrove | 33 | 38,585(0.09%)#92 | 1,203,841(0.00%)#2,177 |
| 93. | Morton Borough | 31 | 38,585(0.08%)#93 | 1,203,841(0.00%)#2,232 |
| 94. | Scotland | 31 | 38,585(0.08%)#94 | 1,203,841(0.00%)#2,233 |
| 95. | Bala Cynwyd | 30 | 38,585(0.08%)#95 | 1,203,841(0.00%)#2,255 |
| 96. | Villanova | 30 | 38,585(0.08%)#96 | 1,203,841(0.00%)#2,256 |
| 97. | West Wyomissing | 30 | 38,585(0.08%)#97 | 1,203,841(0.00%)#2,262 |
| 98. | Paoli | 29 | 38,585(0.08%)#98 | 1,203,841(0.00%)#2,284 |
| 99. | Berwick Borough | 28 | 38,585(0.07%)#99 | 1,203,841(0.00%)#2,319 |
| 100. | Lock Haven | 28 | 38,585(0.07%)#100 | 1,203,841(0.00%)#2,323 |
Common Questions
What are the Top 10 Cities with the Largest Jamaican Community in Pennsylvania?
Top 10 Cities with the Largest Jamaican Community in Pennsylvania are:
#1
13,723
#2
896
#3
885
#4
579
#5
484
#6
441
#7
363
#8
316
#9
270
#10
264
What city has the Largest Jamaican Community in Pennsylvania?
Philadelphia has the Largest Jamaican Community in Pennsylvania with 13,723.
What is the Total Jamaican Population in the State of Pennsylvania?
Total Jamaican Population in Pennsylvania is 38,585.
What is the Total Jamaican Population in the United States?
Total Jamaican Population in the United States is 1,203,841.