Cities with the Largest Jamaican Community in New York
RELATED REPORTS & OPTIONS
Jamaican
New York
Compare Cities
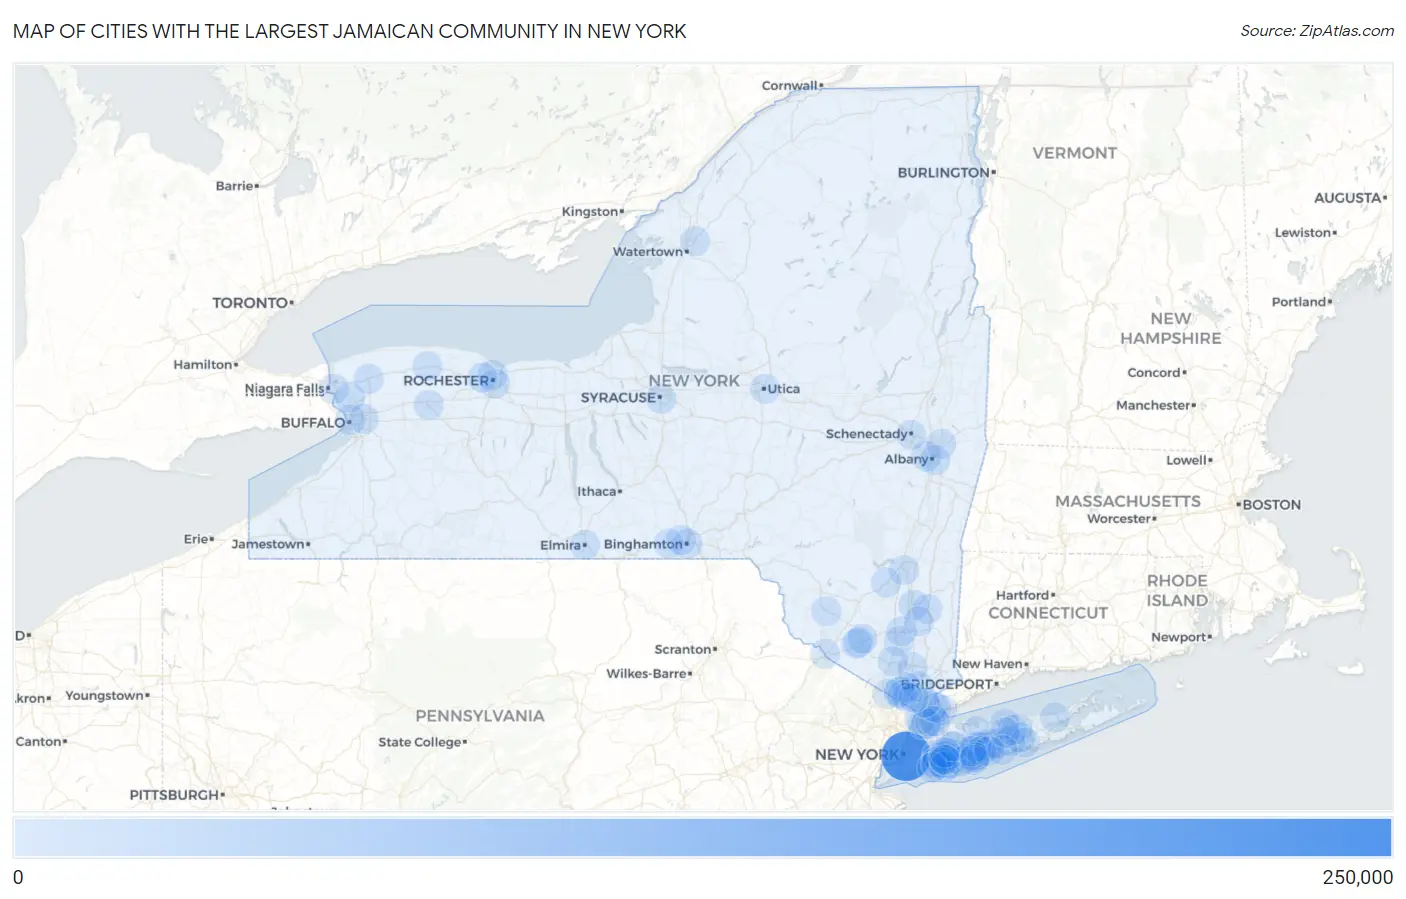
Map of Cities with the Largest Jamaican Community in New York
0
250,000
Cities with the Largest Jamaican Community in New York
| City | Jamaican | vs State | vs National | |
| 1. | New York | 215,958 | 309,071(69.87%)#1 | 1,203,841(17.94%)#1 |
| 2. | Mount Vernon | 12,898 | 309,071(4.17%)#2 | 1,203,841(1.07%)#5 |
| 3. | Yonkers | 5,240 | 309,071(1.70%)#3 | 1,203,841(0.44%)#25 |
| 4. | Hempstead | 3,986 | 309,071(1.29%)#4 | 1,203,841(0.33%)#34 |
| 5. | Rochester | 2,937 | 309,071(0.95%)#5 | 1,203,841(0.24%)#44 |
| 6. | Baldwin | 2,628 | 309,071(0.85%)#6 | 1,203,841(0.22%)#50 |
| 7. | Albany | 2,095 | 309,071(0.68%)#7 | 1,203,841(0.17%)#58 |
| 8. | Elmont | 2,093 | 309,071(0.68%)#8 | 1,203,841(0.17%)#59 |
| 9. | Uniondale | 1,976 | 309,071(0.64%)#9 | 1,203,841(0.16%)#63 |
| 10. | Poughkeepsie | 1,933 | 309,071(0.63%)#10 | 1,203,841(0.16%)#64 |
| 11. | New Rochelle | 1,797 | 309,071(0.58%)#11 | 1,203,841(0.15%)#69 |
| 12. | North Valley Stream | 1,757 | 309,071(0.57%)#12 | 1,203,841(0.15%)#73 |
| 13. | North Amityville | 1,644 | 309,071(0.53%)#13 | 1,203,841(0.14%)#83 |
| 14. | Freeport | 1,607 | 309,071(0.52%)#14 | 1,203,841(0.13%)#84 |
| 15. | Valley Stream | 1,456 | 309,071(0.47%)#15 | 1,203,841(0.12%)#91 |
| 16. | Roosevelt | 1,345 | 309,071(0.44%)#16 | 1,203,841(0.11%)#98 |
| 17. | Syracuse | 1,318 | 309,071(0.43%)#17 | 1,203,841(0.11%)#100 |
| 18. | White Plains | 1,120 | 309,071(0.36%)#18 | 1,203,841(0.09%)#125 |
| 19. | Middletown | 1,079 | 309,071(0.35%)#19 | 1,203,841(0.09%)#131 |
| 20. | Wyandanch | 995 | 309,071(0.32%)#20 | 1,203,841(0.08%)#146 |
| 21. | Buffalo | 874 | 309,071(0.28%)#21 | 1,203,841(0.07%)#173 |
| 22. | Deer Park | 741 | 309,071(0.24%)#22 | 1,203,841(0.06%)#198 |
| 23. | South Valley Stream | 601 | 309,071(0.19%)#23 | 1,203,841(0.05%)#233 |
| 24. | Spring Valley | 597 | 309,071(0.19%)#24 | 1,203,841(0.05%)#235 |
| 25. | West Babylon | 589 | 309,071(0.19%)#25 | 1,203,841(0.05%)#241 |
| 26. | Vails Gate | 557 | 309,071(0.18%)#26 | 1,203,841(0.05%)#257 |
| 27. | East Massapequa | 541 | 309,071(0.18%)#27 | 1,203,841(0.04%)#268 |
| 28. | Ossining | 540 | 309,071(0.17%)#28 | 1,203,841(0.04%)#269 |
| 29. | Peekskill | 499 | 309,071(0.16%)#29 | 1,203,841(0.04%)#285 |
| 30. | Brentwood | 492 | 309,071(0.16%)#30 | 1,203,841(0.04%)#287 |
| 31. | Kingston | 486 | 309,071(0.16%)#31 | 1,203,841(0.04%)#293 |
| 32. | Mechanicstown | 432 | 309,071(0.14%)#32 | 1,203,841(0.04%)#318 |
| 33. | Central Islip | 427 | 309,071(0.14%)#33 | 1,203,841(0.04%)#321 |
| 34. | Lockport | 422 | 309,071(0.14%)#34 | 1,203,841(0.04%)#326 |
| 35. | North Bay Shore | 420 | 309,071(0.14%)#35 | 1,203,841(0.03%)#328 |
| 36. | Niagara Falls | 417 | 309,071(0.13%)#36 | 1,203,841(0.03%)#330 |
| 37. | Fairview Cdp Dutchess County | 416 | 309,071(0.13%)#37 | 1,203,841(0.03%)#332 |
| 38. | Coram | 400 | 309,071(0.13%)#38 | 1,203,841(0.03%)#339 |
| 39. | Utica | 395 | 309,071(0.13%)#39 | 1,203,841(0.03%)#342 |
| 40. | Westbury | 366 | 309,071(0.12%)#40 | 1,203,841(0.03%)#373 |
| 41. | Wheatley Heights | 358 | 309,071(0.12%)#41 | 1,203,841(0.03%)#382 |
| 42. | Hillcrest | 347 | 309,071(0.11%)#42 | 1,203,841(0.03%)#392 |
| 43. | Troy | 341 | 309,071(0.11%)#43 | 1,203,841(0.03%)#398 |
| 44. | Riverhead | 337 | 309,071(0.11%)#44 | 1,203,841(0.03%)#403 |
| 45. | West Hempstead | 328 | 309,071(0.11%)#45 | 1,203,841(0.03%)#412 |
| 46. | New City | 321 | 309,071(0.10%)#46 | 1,203,841(0.03%)#416 |
| 47. | Scotchtown | 320 | 309,071(0.10%)#47 | 1,203,841(0.03%)#422 |
| 48. | Woodmere | 280 | 309,071(0.09%)#48 | 1,203,841(0.02%)#469 |
| 49. | Binghamton | 273 | 309,071(0.09%)#49 | 1,203,841(0.02%)#482 |
| 50. | Holbrook | 268 | 309,071(0.09%)#50 | 1,203,841(0.02%)#492 |
| 51. | Balmville | 264 | 309,071(0.09%)#51 | 1,203,841(0.02%)#503 |
| 52. | Johnson City | 263 | 309,071(0.09%)#52 | 1,203,841(0.02%)#506 |
| 53. | Schenectady | 254 | 309,071(0.08%)#53 | 1,203,841(0.02%)#520 |
| 54. | Stone Ridge | 249 | 309,071(0.08%)#54 | 1,203,841(0.02%)#532 |
| 55. | Lynbrook | 244 | 309,071(0.08%)#55 | 1,203,841(0.02%)#543 |
| 56. | Greenlawn | 243 | 309,071(0.08%)#56 | 1,203,841(0.02%)#545 |
| 57. | Monticello | 243 | 309,071(0.08%)#57 | 1,203,841(0.02%)#546 |
| 58. | Inwood | 223 | 309,071(0.07%)#58 | 1,203,841(0.02%)#588 |
| 59. | Port Chester | 217 | 309,071(0.07%)#59 | 1,203,841(0.02%)#601 |
| 60. | Albion | 209 | 309,071(0.07%)#60 | 1,203,841(0.02%)#617 |
| 61. | North Babylon | 201 | 309,071(0.07%)#61 | 1,203,841(0.02%)#644 |
| 62. | Stony Brook University | 198 | 309,071(0.06%)#62 | 1,203,841(0.02%)#648 |
| 63. | Pelham | 193 | 309,071(0.06%)#63 | 1,203,841(0.02%)#659 |
| 64. | Seaford | 190 | 309,071(0.06%)#64 | 1,203,841(0.02%)#671 |
| 65. | Batavia | 189 | 309,071(0.06%)#65 | 1,203,841(0.02%)#675 |
| 66. | Harrison | 187 | 309,071(0.06%)#66 | 1,203,841(0.02%)#684 |
| 67. | Oceanside | 186 | 309,071(0.06%)#67 | 1,203,841(0.02%)#687 |
| 68. | West Nyack | 185 | 309,071(0.06%)#68 | 1,203,841(0.02%)#689 |
| 69. | Freedom Plains | 183 | 309,071(0.06%)#69 | 1,203,841(0.02%)#694 |
| 70. | Fairview Cdp Westchester County | 179 | 309,071(0.06%)#70 | 1,203,841(0.01%)#706 |
| 71. | Cheektowaga | 176 | 309,071(0.06%)#71 | 1,203,841(0.01%)#716 |
| 72. | Medford | 176 | 309,071(0.06%)#72 | 1,203,841(0.01%)#719 |
| 73. | Endicott | 174 | 309,071(0.06%)#73 | 1,203,841(0.01%)#722 |
| 74. | Lakeview | 174 | 309,071(0.06%)#74 | 1,203,841(0.01%)#724 |
| 75. | Elmira | 169 | 309,071(0.05%)#75 | 1,203,841(0.01%)#738 |
| 76. | Nanuet | 168 | 309,071(0.05%)#76 | 1,203,841(0.01%)#742 |
| 77. | Suffern | 165 | 309,071(0.05%)#77 | 1,203,841(0.01%)#755 |
| 78. | Selden | 161 | 309,071(0.05%)#78 | 1,203,841(0.01%)#773 |
| 79. | Woodbury | 160 | 309,071(0.05%)#79 | 1,203,841(0.01%)#777 |
| 80. | East Farmingdale | 160 | 309,071(0.05%)#80 | 1,203,841(0.01%)#778 |
| 81. | Copiague | 157 | 309,071(0.05%)#81 | 1,203,841(0.01%)#786 |
| 82. | New Cassel | 156 | 309,071(0.05%)#82 | 1,203,841(0.01%)#789 |
| 83. | North Bellport | 155 | 309,071(0.05%)#83 | 1,203,841(0.01%)#791 |
| 84. | Brighton | 150 | 309,071(0.05%)#84 | 1,203,841(0.01%)#813 |
| 85. | Bay Shore | 150 | 309,071(0.05%)#85 | 1,203,841(0.01%)#814 |
| 86. | North Tonawanda | 149 | 309,071(0.05%)#86 | 1,203,841(0.01%)#820 |
| 87. | Lake Grove | 143 | 309,071(0.05%)#87 | 1,203,841(0.01%)#849 |
| 88. | Garden City | 139 | 309,071(0.04%)#88 | 1,203,841(0.01%)#862 |
| 89. | Rockville Centre | 138 | 309,071(0.04%)#89 | 1,203,841(0.01%)#866 |
| 90. | Mamaroneck | 138 | 309,071(0.04%)#90 | 1,203,841(0.01%)#867 |
| 91. | Elmsford | 134 | 309,071(0.04%)#91 | 1,203,841(0.01%)#891 |
| 92. | Nyack | 133 | 309,071(0.04%)#92 | 1,203,841(0.01%)#900 |
| 93. | Oakdale | 132 | 309,071(0.04%)#93 | 1,203,841(0.01%)#911 |
| 94. | Port Jervis | 130 | 309,071(0.04%)#94 | 1,203,841(0.01%)#919 |
| 95. | Loudonville | 127 | 309,071(0.04%)#95 | 1,203,841(0.01%)#931 |
| 96. | Myers Corner | 123 | 309,071(0.04%)#96 | 1,203,841(0.01%)#946 |
| 97. | North Gates | 122 | 309,071(0.04%)#97 | 1,203,841(0.01%)#951 |
| 98. | Rensselaer | 121 | 309,071(0.04%)#98 | 1,203,841(0.01%)#958 |
| 99. | Lindenhurst | 120 | 309,071(0.04%)#99 | 1,203,841(0.01%)#965 |
| 100. | Calcium | 119 | 309,071(0.04%)#100 | 1,203,841(0.01%)#975 |
Common Questions
What are the Top 10 Cities with the Largest Jamaican Community in New York?
Top 10 Cities with the Largest Jamaican Community in New York are:
#1
215,958
#2
12,898
#3
5,240
#4
3,986
#5
2,937
#6
2,628
#7
2,095
#8
2,093
#9
1,976
#10
1,933
What city has the Largest Jamaican Community in New York?
New York has the Largest Jamaican Community in New York with 215,958.
What is the Total Jamaican Population in the State of New York?
Total Jamaican Population in New York is 309,071.
What is the Total Jamaican Population in the United States?
Total Jamaican Population in the United States is 1,203,841.