Cities with the Largest Jamaican Community in South Carolina
RELATED REPORTS & OPTIONS
Jamaican
South Carolina
Compare Cities
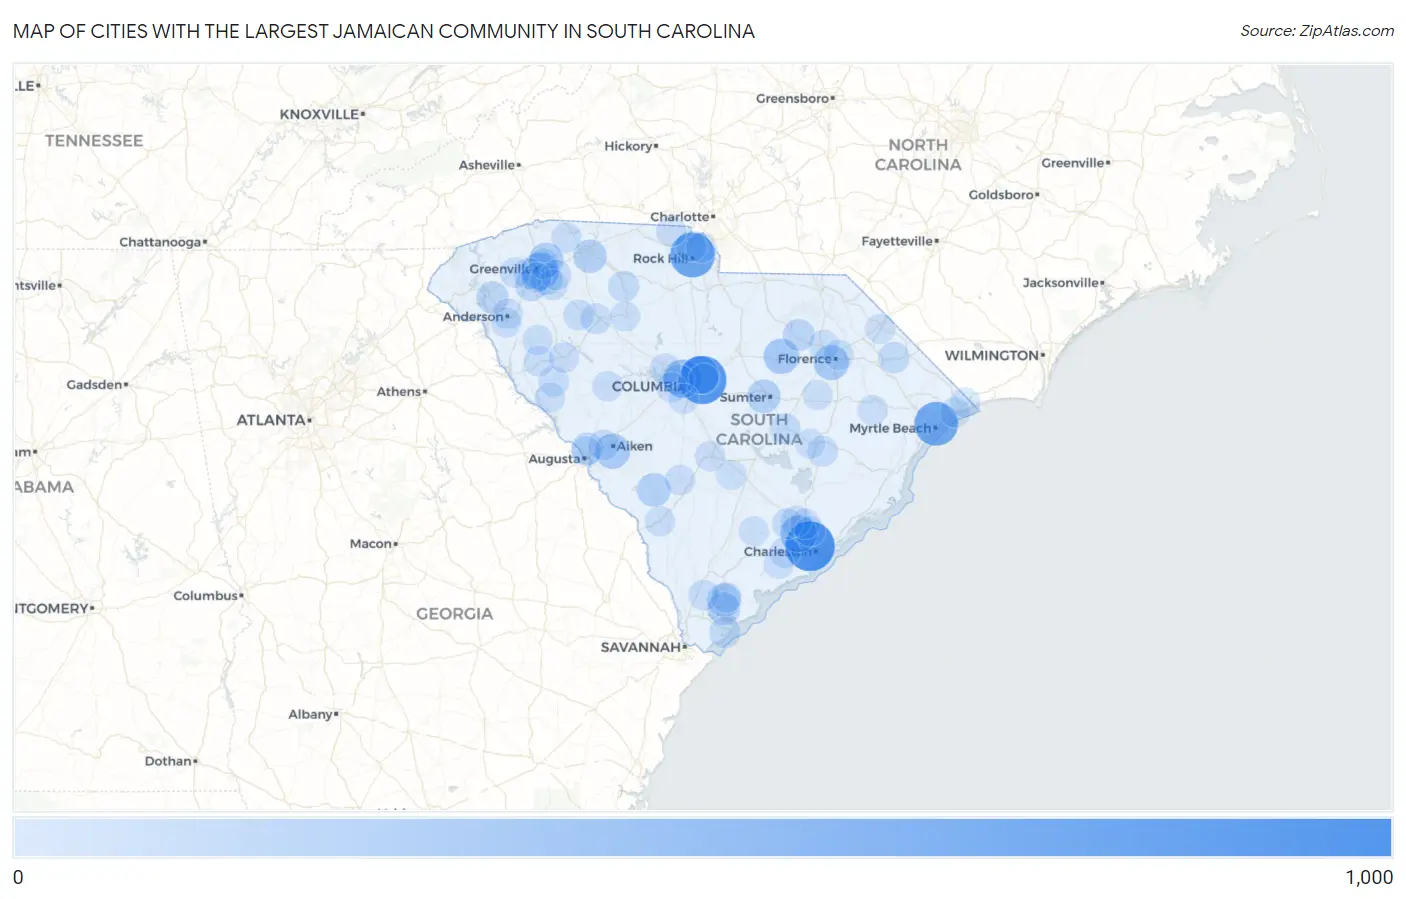
Map of Cities with the Largest Jamaican Community in South Carolina
0
1,000
Cities with the Largest Jamaican Community in South Carolina
| City | Jamaican | vs State | vs National | |
| 1. | Charleston | 884 | 10,450(8.46%)#1 | 1,203,841(0.07%)#171 |
| 2. | Columbia | 810 | 10,450(7.75%)#2 | 1,203,841(0.07%)#183 |
| 3. | Rock Hill | 661 | 10,450(6.33%)#3 | 1,203,841(0.05%)#213 |
| 4. | Myrtle Beach | 613 | 10,450(5.87%)#4 | 1,203,841(0.05%)#230 |
| 5. | St Andrews | 375 | 10,450(3.59%)#5 | 1,203,841(0.03%)#364 |
| 6. | Dentsville | 352 | 10,450(3.37%)#6 | 1,203,841(0.03%)#389 |
| 7. | Greenville | 316 | 10,450(3.02%)#7 | 1,203,841(0.03%)#424 |
| 8. | North Charleston | 304 | 10,450(2.91%)#8 | 1,203,841(0.03%)#439 |
| 9. | Bishopville | 232 | 10,450(2.22%)#9 | 1,203,841(0.02%)#564 |
| 10. | Florence | 226 | 10,450(2.16%)#10 | 1,203,841(0.02%)#575 |
| 11. | Aiken | 219 | 10,450(2.10%)#11 | 1,203,841(0.02%)#594 |
| 12. | Carolina Forest | 210 | 10,450(2.01%)#12 | 1,203,841(0.02%)#609 |
| 13. | Taylors | 197 | 10,450(1.89%)#13 | 1,203,841(0.02%)#652 |
| 14. | Barnwell | 164 | 10,450(1.57%)#14 | 1,203,841(0.01%)#760 |
| 15. | Sumter | 149 | 10,450(1.43%)#15 | 1,203,841(0.01%)#817 |
| 16. | Spartanburg | 149 | 10,450(1.43%)#16 | 1,203,841(0.01%)#818 |
| 17. | Burton | 146 | 10,450(1.40%)#17 | 1,203,841(0.01%)#839 |
| 18. | Port Royal | 122 | 10,450(1.17%)#18 | 1,203,841(0.01%)#950 |
| 19. | Pendleton | 91 | 10,450(0.87%)#19 | 1,203,841(0.01%)#1,201 |
| 20. | Golden Grove | 90 | 10,450(0.86%)#20 | 1,203,841(0.01%)#1,216 |
| 21. | Belvedere | 89 | 10,450(0.85%)#21 | 1,203,841(0.01%)#1,232 |
| 22. | Hartsville | 84 | 10,450(0.80%)#22 | 1,203,841(0.01%)#1,284 |
| 23. | Mauldin | 70 | 10,450(0.67%)#23 | 1,203,841(0.01%)#1,429 |
| 24. | Mullins | 54 | 10,450(0.52%)#24 | 1,203,841(0.00%)#1,686 |
| 25. | Welcome | 50 | 10,450(0.48%)#25 | 1,203,841(0.00%)#1,758 |
| 26. | Hilton Head Island | 49 | 10,450(0.47%)#26 | 1,203,841(0.00%)#1,768 |
| 27. | Manning | 49 | 10,450(0.47%)#27 | 1,203,841(0.00%)#1,779 |
| 28. | Union | 48 | 10,450(0.46%)#28 | 1,203,841(0.00%)#1,798 |
| 29. | Ravenel | 37 | 10,450(0.35%)#29 | 1,203,841(0.00%)#2,059 |
| 30. | Clinton | 32 | 10,450(0.31%)#30 | 1,203,841(0.00%)#2,192 |
| 31. | India Hook | 32 | 10,450(0.31%)#31 | 1,203,841(0.00%)#2,198 |
| 32. | Graniteville | 32 | 10,450(0.31%)#32 | 1,203,841(0.00%)#2,202 |
| 33. | Wade Hampton | 31 | 10,450(0.30%)#33 | 1,203,841(0.00%)#2,215 |
| 34. | Laurens | 31 | 10,450(0.30%)#34 | 1,203,841(0.00%)#2,223 |
| 35. | Seven Oaks | 29 | 10,450(0.28%)#35 | 1,203,841(0.00%)#2,271 |
| 36. | Ladson | 29 | 10,450(0.28%)#36 | 1,203,841(0.00%)#2,272 |
| 37. | Summerville | 27 | 10,450(0.26%)#37 | 1,203,841(0.00%)#2,341 |
| 38. | Simpsonville | 26 | 10,450(0.25%)#38 | 1,203,841(0.00%)#2,396 |
| 39. | Ridgeland | 26 | 10,450(0.25%)#39 | 1,203,841(0.00%)#2,416 |
| 40. | Bradley | 26 | 10,450(0.25%)#40 | 1,203,841(0.00%)#2,426 |
| 41. | Lake Murray Of Richland | 25 | 10,450(0.24%)#41 | 1,203,841(0.00%)#2,445 |
| 42. | Clover | 25 | 10,450(0.24%)#42 | 1,203,841(0.00%)#2,447 |
| 43. | Lane | 25 | 10,450(0.24%)#43 | 1,203,841(0.00%)#2,456 |
| 44. | Abbeville | 22 | 10,450(0.21%)#44 | 1,203,841(0.00%)#2,570 |
| 45. | Orangeburg | 21 | 10,450(0.20%)#45 | 1,203,841(0.00%)#2,608 |
| 46. | Five Forks | 19 | 10,450(0.18%)#46 | 1,203,841(0.00%)#2,700 |
| 47. | Goose Creek | 17 | 10,450(0.16%)#47 | 1,203,841(0.00%)#2,790 |
| 48. | Denmark | 17 | 10,450(0.16%)#48 | 1,203,841(0.00%)#2,829 |
| 49. | Beaufort | 16 | 10,450(0.15%)#49 | 1,203,841(0.00%)#2,863 |
| 50. | Saluda | 16 | 10,450(0.15%)#50 | 1,203,841(0.00%)#2,883 |
| 51. | Gramling | 16 | 10,450(0.15%)#51 | 1,203,841(0.00%)#2,896 |
| 52. | Due West | 15 | 10,450(0.14%)#52 | 1,203,841(0.00%)#2,958 |
| 53. | Anderson | 13 | 10,450(0.12%)#53 | 1,203,841(0.00%)#3,032 |
| 54. | Fort Mill | 13 | 10,450(0.12%)#54 | 1,203,841(0.00%)#3,033 |
| 55. | Homeland Park | 13 | 10,450(0.12%)#55 | 1,203,841(0.00%)#3,057 |
| 56. | Woodfield | 12 | 10,450(0.11%)#56 | 1,203,841(0.00%)#3,125 |
| 57. | Lexington | 10 | 10,450(0.10%)#57 | 1,203,841(0.00%)#3,259 |
| 58. | Easley | 10 | 10,450(0.10%)#58 | 1,203,841(0.00%)#3,260 |
| 59. | Greenwood | 9 | 10,450(0.09%)#59 | 1,203,841(0.00%)#3,352 |
| 60. | Darlington | 9 | 10,450(0.09%)#60 | 1,203,841(0.00%)#3,383 |
| 61. | Allendale | 9 | 10,450(0.09%)#61 | 1,203,841(0.00%)#3,400 |
| 62. | Quinby | 9 | 10,450(0.09%)#62 | 1,203,841(0.00%)#3,415 |
| 63. | Hanahan | 8 | 10,450(0.08%)#63 | 1,203,841(0.00%)#3,441 |
| 64. | Pine Ridge | 8 | 10,450(0.08%)#64 | 1,203,841(0.00%)#3,501 |
| 65. | Gantt | 7 | 10,450(0.07%)#65 | 1,203,841(0.00%)#3,569 |
| 66. | Johnsonville | 5 | 10,450(0.05%)#66 | 1,203,841(0.00%)#3,783 |
| 67. | Atlantic Beach | 5 | 10,450(0.05%)#67 | 1,203,841(0.00%)#3,801 |
| 68. | Dillon | 4 | 10,450(0.04%)#68 | 1,203,841(0.00%)#3,831 |
| 69. | Meggett | 4 | 10,450(0.04%)#69 | 1,203,841(0.00%)#3,864 |
| 70. | Bowman | 4 | 10,450(0.04%)#70 | 1,203,841(0.00%)#3,881 |
| 71. | Little River | 3 | 10,450(0.03%)#71 | 1,203,841(0.00%)#3,907 |
| 72. | Mccormick | 2 | 10,450(0.02%)#72 | 1,203,841(0.00%)#4,008 |
| 73. | Cottageville | 2 | 10,450(0.02%)#73 | 1,203,841(0.00%)#4,028 |
| 74. | Olanta | 2 | 10,450(0.02%)#74 | 1,203,841(0.00%)#4,044 |
| 75. | North Augusta | 1 | 10,450(0.01%)#75 | 1,203,841(0.00%)#4,072 |
| 76. | Clemson University | 1 | 10,450(0.01%)#76 | 1,203,841(0.00%)#4,096 |
| 77. | Whitmire | 1 | 10,450(0.01%)#77 | 1,203,841(0.00%)#4,127 |
| 78. | Greeleyville | 1 | 10,450(0.01%)#78 | 1,203,841(0.00%)#4,143 |
Common Questions
What are the Top 10 Cities with the Largest Jamaican Community in South Carolina?
Top 10 Cities with the Largest Jamaican Community in South Carolina are:
#1
884
#2
810
#3
661
#4
613
#5
375
#6
352
#7
316
#8
304
#9
232
#10
226
What city has the Largest Jamaican Community in South Carolina?
Charleston has the Largest Jamaican Community in South Carolina with 884.
What is the Total Jamaican Population in the State of South Carolina?
Total Jamaican Population in South Carolina is 10,450.
What is the Total Jamaican Population in the United States?
Total Jamaican Population in the United States is 1,203,841.