Cities with the Largest Jamaican Community in Illinois
RELATED REPORTS & OPTIONS
Jamaican
Illinois
Compare Cities
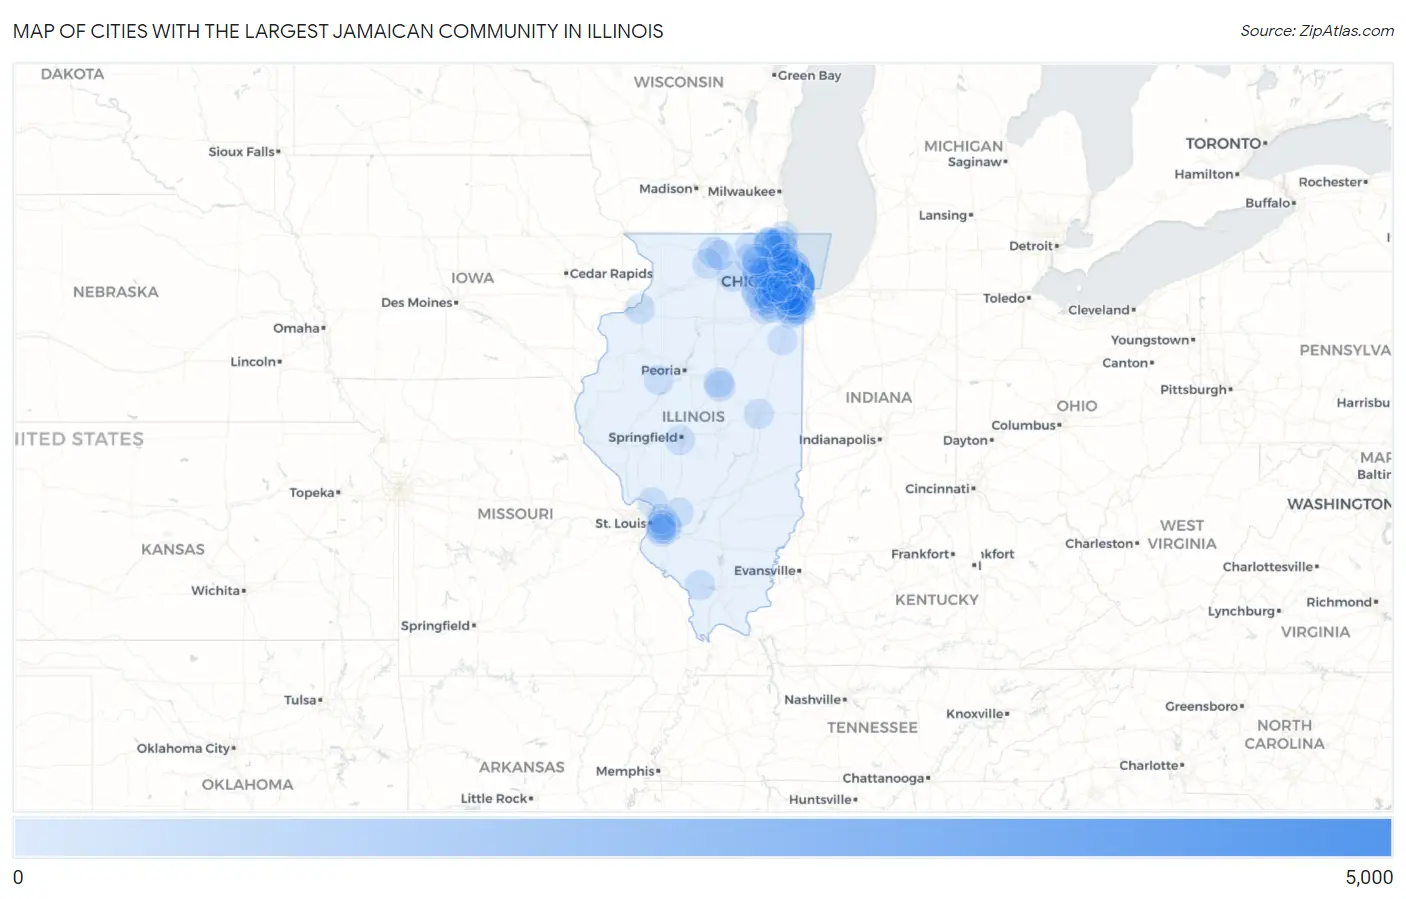
Map of Cities with the Largest Jamaican Community in Illinois
0
5,000
Cities with the Largest Jamaican Community in Illinois
| City | Jamaican | vs State | vs National | |
| 1. | Chicago | 4,470 | 15,157(29.49%)#1 | 1,203,841(0.37%)#31 |
| 2. | Evanston | 1,043 | 15,157(6.88%)#2 | 1,203,841(0.09%)#140 |
| 3. | Skokie | 808 | 15,157(5.33%)#3 | 1,203,841(0.07%)#184 |
| 4. | Waukegan | 416 | 15,157(2.74%)#4 | 1,203,841(0.03%)#331 |
| 5. | Schaumburg | 348 | 15,157(2.30%)#5 | 1,203,841(0.03%)#391 |
| 6. | Aurora | 264 | 15,157(1.74%)#6 | 1,203,841(0.02%)#501 |
| 7. | Rockford | 222 | 15,157(1.46%)#7 | 1,203,841(0.02%)#589 |
| 8. | Bolingbrook | 218 | 15,157(1.44%)#8 | 1,203,841(0.02%)#597 |
| 9. | Mount Prospect | 207 | 15,157(1.37%)#9 | 1,203,841(0.02%)#621 |
| 10. | Carol Stream | 201 | 15,157(1.33%)#10 | 1,203,841(0.02%)#641 |
| 11. | Joliet | 192 | 15,157(1.27%)#11 | 1,203,841(0.02%)#661 |
| 12. | Lombard | 192 | 15,157(1.27%)#12 | 1,203,841(0.02%)#663 |
| 13. | Hoffman Estates | 188 | 15,157(1.24%)#13 | 1,203,841(0.02%)#679 |
| 14. | Dekalb | 178 | 15,157(1.17%)#14 | 1,203,841(0.01%)#710 |
| 15. | Grayslake | 177 | 15,157(1.17%)#15 | 1,203,841(0.01%)#713 |
| 16. | Shiloh | 168 | 15,157(1.11%)#16 | 1,203,841(0.01%)#743 |
| 17. | Rolling Meadows | 162 | 15,157(1.07%)#17 | 1,203,841(0.01%)#764 |
| 18. | Oak Park | 153 | 15,157(1.01%)#18 | 1,203,841(0.01%)#799 |
| 19. | Bellwood | 143 | 15,157(0.94%)#19 | 1,203,841(0.01%)#847 |
| 20. | Bloomington | 138 | 15,157(0.91%)#20 | 1,203,841(0.01%)#864 |
| 21. | University Park | 134 | 15,157(0.88%)#21 | 1,203,841(0.01%)#890 |
| 22. | Des Plaines | 132 | 15,157(0.87%)#22 | 1,203,841(0.01%)#906 |
| 23. | Country Club Hills | 124 | 15,157(0.82%)#23 | 1,203,841(0.01%)#942 |
| 24. | Mundelein | 123 | 15,157(0.81%)#24 | 1,203,841(0.01%)#945 |
| 25. | Arlington Heights | 115 | 15,157(0.76%)#25 | 1,203,841(0.01%)#1,002 |
| 26. | Belleville | 114 | 15,157(0.75%)#26 | 1,203,841(0.01%)#1,009 |
| 27. | Blue Island | 106 | 15,157(0.70%)#27 | 1,203,841(0.01%)#1,068 |
| 28. | Huntley | 105 | 15,157(0.69%)#28 | 1,203,841(0.01%)#1,077 |
| 29. | Palatine | 104 | 15,157(0.69%)#29 | 1,203,841(0.01%)#1,081 |
| 30. | Melrose Park | 102 | 15,157(0.67%)#30 | 1,203,841(0.01%)#1,101 |
| 31. | Plainfield | 93 | 15,157(0.61%)#31 | 1,203,841(0.01%)#1,184 |
| 32. | Lansing | 89 | 15,157(0.59%)#32 | 1,203,841(0.01%)#1,224 |
| 33. | Geneva | 89 | 15,157(0.59%)#33 | 1,203,841(0.01%)#1,226 |
| 34. | Lisle | 87 | 15,157(0.57%)#34 | 1,203,841(0.01%)#1,244 |
| 35. | Buffalo Grove | 85 | 15,157(0.56%)#35 | 1,203,841(0.01%)#1,263 |
| 36. | Oak Lawn | 83 | 15,157(0.55%)#36 | 1,203,841(0.01%)#1,291 |
| 37. | Normal | 82 | 15,157(0.54%)#37 | 1,203,841(0.01%)#1,305 |
| 38. | Chicago Heights | 79 | 15,157(0.52%)#38 | 1,203,841(0.01%)#1,330 |
| 39. | Stillman Valley | 78 | 15,157(0.51%)#39 | 1,203,841(0.01%)#1,351 |
| 40. | Homewood | 76 | 15,157(0.50%)#40 | 1,203,841(0.01%)#1,364 |
| 41. | Forest Park | 73 | 15,157(0.48%)#41 | 1,203,841(0.01%)#1,388 |
| 42. | O Fallon | 72 | 15,157(0.48%)#42 | 1,203,841(0.01%)#1,399 |
| 43. | Crest Hill | 71 | 15,157(0.47%)#43 | 1,203,841(0.01%)#1,416 |
| 44. | Berkeley | 66 | 15,157(0.44%)#44 | 1,203,841(0.01%)#1,491 |
| 45. | South Holland | 64 | 15,157(0.42%)#45 | 1,203,841(0.01%)#1,511 |
| 46. | River Forest | 64 | 15,157(0.42%)#46 | 1,203,841(0.01%)#1,514 |
| 47. | Addison | 60 | 15,157(0.40%)#47 | 1,203,841(0.00%)#1,569 |
| 48. | North Chicago | 60 | 15,157(0.40%)#48 | 1,203,841(0.00%)#1,570 |
| 49. | Maywood | 59 | 15,157(0.39%)#49 | 1,203,841(0.00%)#1,589 |
| 50. | Alton | 56 | 15,157(0.37%)#50 | 1,203,841(0.00%)#1,644 |
| 51. | Romeoville | 55 | 15,157(0.36%)#51 | 1,203,841(0.00%)#1,664 |
| 52. | Calumet City | 51 | 15,157(0.34%)#52 | 1,203,841(0.00%)#1,735 |
| 53. | East Moline | 50 | 15,157(0.33%)#53 | 1,203,841(0.00%)#1,756 |
| 54. | Matteson | 50 | 15,157(0.33%)#54 | 1,203,841(0.00%)#1,757 |
| 55. | Naperville | 49 | 15,157(0.32%)#55 | 1,203,841(0.00%)#1,764 |
| 56. | Round Lake | 49 | 15,157(0.32%)#56 | 1,203,841(0.00%)#1,771 |
| 57. | Wheaton | 48 | 15,157(0.32%)#57 | 1,203,841(0.00%)#1,783 |
| 58. | Springfield | 47 | 15,157(0.31%)#58 | 1,203,841(0.00%)#1,802 |
| 59. | Sauk Village | 46 | 15,157(0.30%)#59 | 1,203,841(0.00%)#1,837 |
| 60. | Lemont | 44 | 15,157(0.29%)#60 | 1,203,841(0.00%)#1,877 |
| 61. | Elgin | 42 | 15,157(0.28%)#61 | 1,203,841(0.00%)#1,919 |
| 62. | Lincolnwood | 41 | 15,157(0.27%)#62 | 1,203,841(0.00%)#1,951 |
| 63. | Dolton | 39 | 15,157(0.26%)#63 | 1,203,841(0.00%)#1,998 |
| 64. | Downers Grove | 38 | 15,157(0.25%)#64 | 1,203,841(0.00%)#2,015 |
| 65. | Libertyville | 37 | 15,157(0.24%)#65 | 1,203,841(0.00%)#2,036 |
| 66. | Cicero | 36 | 15,157(0.24%)#66 | 1,203,841(0.00%)#2,063 |
| 67. | Woodstock | 35 | 15,157(0.23%)#67 | 1,203,841(0.00%)#2,100 |
| 68. | Champaign | 33 | 15,157(0.22%)#68 | 1,203,841(0.00%)#2,146 |
| 69. | Murphysboro | 32 | 15,157(0.21%)#69 | 1,203,841(0.00%)#2,194 |
| 70. | Wheeling | 31 | 15,157(0.20%)#70 | 1,203,841(0.00%)#2,212 |
| 71. | Collinsville | 31 | 15,157(0.20%)#71 | 1,203,841(0.00%)#2,214 |
| 72. | Harvey | 31 | 15,157(0.20%)#72 | 1,203,841(0.00%)#2,217 |
| 73. | Bloomingdale | 30 | 15,157(0.20%)#73 | 1,203,841(0.00%)#2,245 |
| 74. | Park Forest | 30 | 15,157(0.20%)#74 | 1,203,841(0.00%)#2,248 |
| 75. | Cherry Valley | 29 | 15,157(0.19%)#75 | 1,203,841(0.00%)#2,289 |
| 76. | Zion | 28 | 15,157(0.18%)#76 | 1,203,841(0.00%)#2,308 |
| 77. | Highland | 28 | 15,157(0.18%)#77 | 1,203,841(0.00%)#2,320 |
| 78. | Boulder Hill | 28 | 15,157(0.18%)#78 | 1,203,841(0.00%)#2,321 |
| 79. | South Elgin | 27 | 15,157(0.18%)#79 | 1,203,841(0.00%)#2,351 |
| 80. | Midlothian | 27 | 15,157(0.18%)#80 | 1,203,841(0.00%)#2,359 |
| 81. | Markham | 27 | 15,157(0.18%)#81 | 1,203,841(0.00%)#2,365 |
| 82. | Northbrook | 26 | 15,157(0.17%)#82 | 1,203,841(0.00%)#2,392 |
| 83. | Highland Park | 25 | 15,157(0.16%)#83 | 1,203,841(0.00%)#2,431 |
| 84. | Bartlett | 24 | 15,157(0.16%)#84 | 1,203,841(0.00%)#2,462 |
| 85. | Ingalls Park | 24 | 15,157(0.16%)#85 | 1,203,841(0.00%)#2,486 |
| 86. | Kankakee | 23 | 15,157(0.15%)#86 | 1,203,841(0.00%)#2,503 |
| 87. | Gages Lake | 20 | 15,157(0.13%)#87 | 1,203,841(0.00%)#2,660 |
| 88. | Fairview Heights | 19 | 15,157(0.13%)#88 | 1,203,841(0.00%)#2,702 |
| 89. | Worth | 19 | 15,157(0.13%)#89 | 1,203,841(0.00%)#2,711 |
| 90. | Long Lake | 19 | 15,157(0.13%)#90 | 1,203,841(0.00%)#2,730 |
| 91. | Glenview | 18 | 15,157(0.12%)#91 | 1,203,841(0.00%)#2,744 |
| 92. | Carpentersville | 17 | 15,157(0.11%)#92 | 1,203,841(0.00%)#2,793 |
| 93. | Round Lake Beach | 17 | 15,157(0.11%)#93 | 1,203,841(0.00%)#2,799 |
| 94. | Swansea | 17 | 15,157(0.11%)#94 | 1,203,841(0.00%)#2,808 |
| 95. | Woodridge | 16 | 15,157(0.11%)#95 | 1,203,841(0.00%)#2,847 |
| 96. | Algonquin | 16 | 15,157(0.11%)#96 | 1,203,841(0.00%)#2,849 |
| 97. | La Grange | 16 | 15,157(0.11%)#97 | 1,203,841(0.00%)#2,861 |
| 98. | Canton | 15 | 15,157(0.10%)#98 | 1,203,841(0.00%)#2,915 |
| 99. | Deerfield | 14 | 15,157(0.09%)#99 | 1,203,841(0.00%)#2,973 |
| 100. | Westmont | 13 | 15,157(0.09%)#100 | 1,203,841(0.00%)#3,037 |
Common Questions
What are the Top 10 Cities with the Largest Jamaican Community in Illinois?
Top 10 Cities with the Largest Jamaican Community in Illinois are:
#1
4,470
#2
1,043
#3
808
#4
416
#5
348
#6
264
#7
222
#8
218
#9
207
#10
201
What city has the Largest Jamaican Community in Illinois?
Chicago has the Largest Jamaican Community in Illinois with 4,470.
What is the Total Jamaican Population in the State of Illinois?
Total Jamaican Population in Illinois is 15,157.
What is the Total Jamaican Population in the United States?
Total Jamaican Population in the United States is 1,203,841.