Cities with the Largest Jamaican Community in Maryland
RELATED REPORTS & OPTIONS
Jamaican
Maryland
Compare Cities
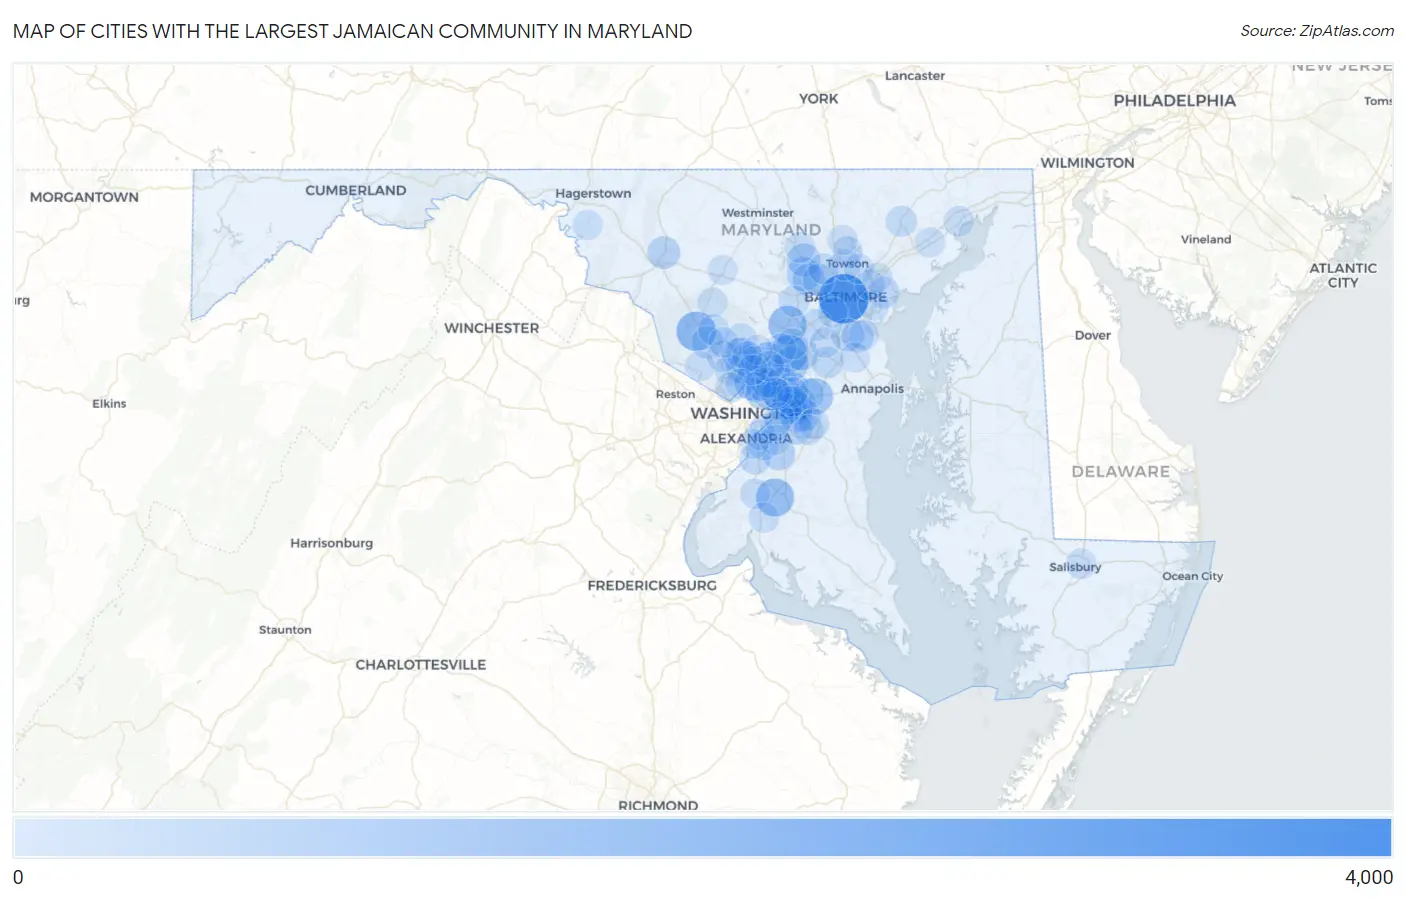
Map of Cities with the Largest Jamaican Community in Maryland
0
4,000
Cities with the Largest Jamaican Community in Maryland
| City | Jamaican | vs State | vs National | |
| 1. | Baltimore | 3,564 | 46,141(7.72%)#1 | 1,203,841(0.30%)#40 |
| 2. | Germantown | 1,739 | 46,141(3.77%)#2 | 1,203,841(0.14%)#75 |
| 3. | Columbia | 1,492 | 46,141(3.23%)#3 | 1,203,841(0.12%)#87 |
| 4. | Waldorf | 1,476 | 46,141(3.20%)#4 | 1,203,841(0.12%)#89 |
| 5. | Laurel | 1,438 | 46,141(3.12%)#5 | 1,203,841(0.12%)#93 |
| 6. | Bowie | 1,147 | 46,141(2.49%)#6 | 1,203,841(0.10%)#121 |
| 7. | Silver Spring | 1,068 | 46,141(2.31%)#7 | 1,203,841(0.09%)#135 |
| 8. | Fairland | 958 | 46,141(2.08%)#8 | 1,203,841(0.08%)#157 |
| 9. | South Laurel | 818 | 46,141(1.77%)#9 | 1,203,841(0.07%)#181 |
| 10. | Chillum | 804 | 46,141(1.74%)#10 | 1,203,841(0.07%)#186 |
| 11. | Randallstown | 777 | 46,141(1.68%)#11 | 1,203,841(0.06%)#192 |
| 12. | Landover | 692 | 46,141(1.50%)#12 | 1,203,841(0.06%)#204 |
| 13. | Seabrook | 684 | 46,141(1.48%)#13 | 1,203,841(0.06%)#206 |
| 14. | Mitchellville | 678 | 46,141(1.47%)#14 | 1,203,841(0.06%)#210 |
| 15. | Owings Mills | 649 | 46,141(1.41%)#15 | 1,203,841(0.05%)#216 |
| 16. | Aspen Hill | 637 | 46,141(1.38%)#16 | 1,203,841(0.05%)#223 |
| 17. | Maryland City | 627 | 46,141(1.36%)#17 | 1,203,841(0.05%)#225 |
| 18. | Clinton | 610 | 46,141(1.32%)#18 | 1,203,841(0.05%)#231 |
| 19. | Lake Arbor | 594 | 46,141(1.29%)#19 | 1,203,841(0.05%)#237 |
| 20. | Frederick | 593 | 46,141(1.29%)#20 | 1,203,841(0.05%)#238 |
| 21. | Largo | 586 | 46,141(1.27%)#21 | 1,203,841(0.05%)#243 |
| 22. | Glen Burnie | 562 | 46,141(1.22%)#22 | 1,203,841(0.05%)#254 |
| 23. | Wheaton | 560 | 46,141(1.21%)#23 | 1,203,841(0.05%)#256 |
| 24. | Greenbelt | 547 | 46,141(1.19%)#24 | 1,203,841(0.05%)#265 |
| 25. | Milford Mill | 545 | 46,141(1.18%)#25 | 1,203,841(0.05%)#267 |
| 26. | Gaithersburg | 525 | 46,141(1.14%)#26 | 1,203,841(0.04%)#276 |
| 27. | Kettering | 524 | 46,141(1.14%)#27 | 1,203,841(0.04%)#278 |
| 28. | Woodlawn Cdp Baltimore County | 506 | 46,141(1.10%)#28 | 1,203,841(0.04%)#283 |
| 29. | Glenarden | 483 | 46,141(1.05%)#29 | 1,203,841(0.04%)#297 |
| 30. | Lochearn | 425 | 46,141(0.92%)#30 | 1,203,841(0.04%)#324 |
| 31. | Westphalia | 420 | 46,141(0.91%)#31 | 1,203,841(0.03%)#329 |
| 32. | Pasadena | 398 | 46,141(0.86%)#32 | 1,203,841(0.03%)#341 |
| 33. | Fort Washington | 381 | 46,141(0.83%)#33 | 1,203,841(0.03%)#360 |
| 34. | Odenton | 380 | 46,141(0.82%)#34 | 1,203,841(0.03%)#361 |
| 35. | Essex | 359 | 46,141(0.78%)#35 | 1,203,841(0.03%)#381 |
| 36. | New Carrollton | 339 | 46,141(0.73%)#36 | 1,203,841(0.03%)#399 |
| 37. | Summerfield | 337 | 46,141(0.73%)#37 | 1,203,841(0.03%)#402 |
| 38. | Elkridge | 332 | 46,141(0.72%)#38 | 1,203,841(0.03%)#408 |
| 39. | Rockville | 315 | 46,141(0.68%)#39 | 1,203,841(0.03%)#427 |
| 40. | Langley Park | 308 | 46,141(0.67%)#40 | 1,203,841(0.03%)#435 |
| 41. | Glenmont | 303 | 46,141(0.66%)#41 | 1,203,841(0.03%)#441 |
| 42. | Towson | 297 | 46,141(0.64%)#42 | 1,203,841(0.02%)#446 |
| 43. | North Laurel | 287 | 46,141(0.62%)#43 | 1,203,841(0.02%)#462 |
| 44. | Olney | 277 | 46,141(0.60%)#44 | 1,203,841(0.02%)#471 |
| 45. | Montgomery Village | 277 | 46,141(0.60%)#45 | 1,203,841(0.02%)#472 |
| 46. | Bel Air North | 276 | 46,141(0.60%)#46 | 1,203,841(0.02%)#475 |
| 47. | College Park | 269 | 46,141(0.58%)#47 | 1,203,841(0.02%)#490 |
| 48. | Hyattsville | 266 | 46,141(0.58%)#48 | 1,203,841(0.02%)#496 |
| 49. | Ellicott City | 265 | 46,141(0.57%)#49 | 1,203,841(0.02%)#498 |
| 50. | Fairwood | 255 | 46,141(0.55%)#50 | 1,203,841(0.02%)#517 |
| 51. | North Bethesda | 248 | 46,141(0.54%)#51 | 1,203,841(0.02%)#533 |
| 52. | Pikesville | 245 | 46,141(0.53%)#52 | 1,203,841(0.02%)#542 |
| 53. | Leisure World | 233 | 46,141(0.50%)#53 | 1,203,841(0.02%)#559 |
| 54. | Oxon Hill | 232 | 46,141(0.50%)#54 | 1,203,841(0.02%)#562 |
| 55. | Dundalk | 228 | 46,141(0.49%)#55 | 1,203,841(0.02%)#569 |
| 56. | White Oak | 226 | 46,141(0.49%)#56 | 1,203,841(0.02%)#576 |
| 57. | Brock Hall | 224 | 46,141(0.49%)#57 | 1,203,841(0.02%)#584 |
| 58. | Severn | 209 | 46,141(0.45%)#58 | 1,203,841(0.02%)#614 |
| 59. | Reisterstown | 208 | 46,141(0.45%)#59 | 1,203,841(0.02%)#619 |
| 60. | Beltsville | 202 | 46,141(0.44%)#60 | 1,203,841(0.02%)#639 |
| 61. | Adelphi | 192 | 46,141(0.42%)#61 | 1,203,841(0.02%)#664 |
| 62. | Colesville | 183 | 46,141(0.40%)#62 | 1,203,841(0.02%)#693 |
| 63. | Lanham | 181 | 46,141(0.39%)#63 | 1,203,841(0.02%)#701 |
| 64. | Salisbury | 176 | 46,141(0.38%)#64 | 1,203,841(0.01%)#717 |
| 65. | Springdale | 171 | 46,141(0.37%)#65 | 1,203,841(0.01%)#731 |
| 66. | Takoma Park | 166 | 46,141(0.36%)#66 | 1,203,841(0.01%)#751 |
| 67. | Bensville | 166 | 46,141(0.36%)#67 | 1,203,841(0.01%)#752 |
| 68. | Havre De Grace | 165 | 46,141(0.36%)#68 | 1,203,841(0.01%)#754 |
| 69. | East Riverdale | 164 | 46,141(0.36%)#69 | 1,203,841(0.01%)#759 |
| 70. | Glassmanor | 155 | 46,141(0.34%)#70 | 1,203,841(0.01%)#790 |
| 71. | Riviera Beach | 152 | 46,141(0.33%)#71 | 1,203,841(0.01%)#806 |
| 72. | West Laurel | 151 | 46,141(0.33%)#72 | 1,203,841(0.01%)#810 |
| 73. | Fairplay | 148 | 46,141(0.32%)#73 | 1,203,841(0.01%)#831 |
| 74. | Rosedale | 143 | 46,141(0.31%)#74 | 1,203,841(0.01%)#846 |
| 75. | Hillcrest Heights | 135 | 46,141(0.29%)#75 | 1,203,841(0.01%)#881 |
| 76. | Marlboro Village | 134 | 46,141(0.29%)#76 | 1,203,841(0.01%)#887 |
| 77. | Redland | 133 | 46,141(0.29%)#77 | 1,203,841(0.01%)#894 |
| 78. | Capitol Heights | 133 | 46,141(0.29%)#78 | 1,203,841(0.01%)#902 |
| 79. | Calverton | 132 | 46,141(0.29%)#79 | 1,203,841(0.01%)#909 |
| 80. | Riverdale Park | 132 | 46,141(0.29%)#80 | 1,203,841(0.01%)#912 |
| 81. | La Plata | 131 | 46,141(0.28%)#81 | 1,203,841(0.01%)#915 |
| 82. | Timonium | 128 | 46,141(0.28%)#82 | 1,203,841(0.01%)#924 |
| 83. | Bethesda | 125 | 46,141(0.27%)#83 | 1,203,841(0.01%)#937 |
| 84. | Parkville | 122 | 46,141(0.26%)#84 | 1,203,841(0.01%)#948 |
| 85. | Lansdowne | 122 | 46,141(0.26%)#85 | 1,203,841(0.01%)#952 |
| 86. | Cloverly | 121 | 46,141(0.26%)#86 | 1,203,841(0.01%)#956 |
| 87. | Riverside | 121 | 46,141(0.26%)#87 | 1,203,841(0.01%)#959 |
| 88. | Damascus | 117 | 46,141(0.25%)#88 | 1,203,841(0.01%)#990 |
| 89. | Flower Hill | 117 | 46,141(0.25%)#89 | 1,203,841(0.01%)#991 |
| 90. | Camp Springs | 116 | 46,141(0.25%)#90 | 1,203,841(0.01%)#997 |
| 91. | Layhill | 116 | 46,141(0.25%)#91 | 1,203,841(0.01%)#999 |
| 92. | National Harbor | 115 | 46,141(0.25%)#92 | 1,203,841(0.01%)#1,007 |
| 93. | Mount Airy | 112 | 46,141(0.24%)#93 | 1,203,841(0.01%)#1,033 |
| 94. | Severna Park | 97 | 46,141(0.21%)#94 | 1,203,841(0.01%)#1,142 |
| 95. | Suitland | 97 | 46,141(0.21%)#95 | 1,203,841(0.01%)#1,144 |
| 96. | Rossville | 96 | 46,141(0.21%)#96 | 1,203,841(0.01%)#1,161 |
| 97. | Travilah | 96 | 46,141(0.21%)#97 | 1,203,841(0.01%)#1,162 |
| 98. | Cockeysville | 95 | 46,141(0.21%)#98 | 1,203,841(0.01%)#1,167 |
| 99. | Kemp Mill | 95 | 46,141(0.21%)#99 | 1,203,841(0.01%)#1,171 |
| 100. | Chevy Chase | 93 | 46,141(0.20%)#100 | 1,203,841(0.01%)#1,188 |
Common Questions
What are the Top 10 Cities with the Largest Jamaican Community in Maryland?
Top 10 Cities with the Largest Jamaican Community in Maryland are:
#1
3,564
#2
1,739
#3
1,492
#4
1,476
#5
1,438
#6
1,147
#7
1,068
#8
958
#9
818
#10
804
What city has the Largest Jamaican Community in Maryland?
Baltimore has the Largest Jamaican Community in Maryland with 3,564.
What is the Total Jamaican Population in the State of Maryland?
Total Jamaican Population in Maryland is 46,141.
What is the Total Jamaican Population in the United States?
Total Jamaican Population in the United States is 1,203,841.