Cities with the Largest Jamaican Community in Missouri
RELATED REPORTS & OPTIONS
Jamaican
Missouri
Compare Cities
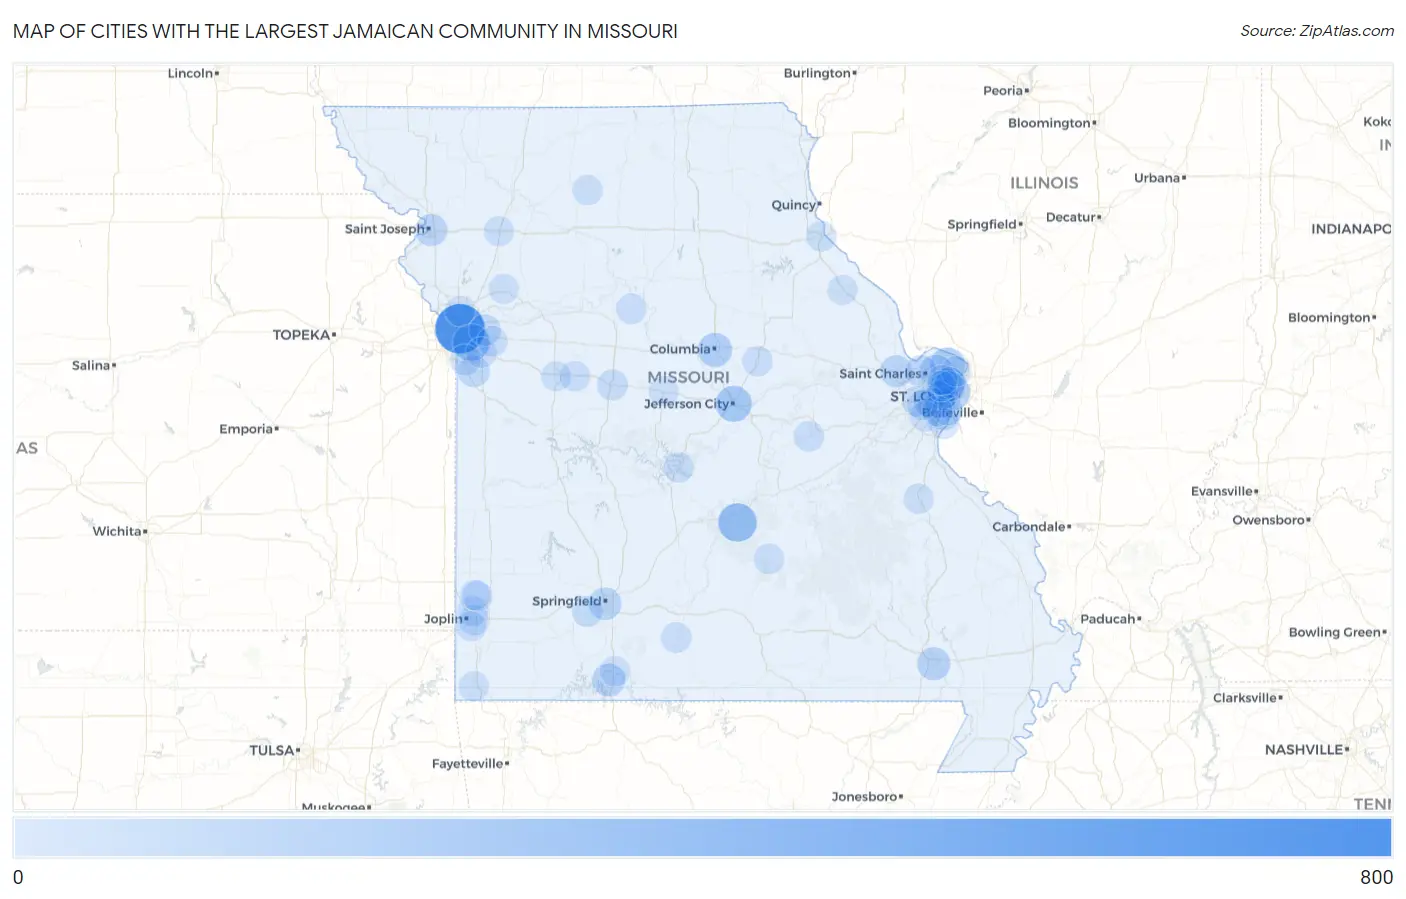
Map of Cities with the Largest Jamaican Community in Missouri
0
800
Cities with the Largest Jamaican Community in Missouri
| City | Jamaican | vs State | vs National | |
| 1. | Kansas City | 763 | 4,208(18.13%)#1 | 1,203,841(0.06%)#193 |
| 2. | Fort Leonard Wood | 321 | 4,208(7.63%)#2 | 1,203,841(0.03%)#418 |
| 3. | Raytown | 268 | 4,208(6.37%)#3 | 1,203,841(0.02%)#491 |
| 4. | Northwoods | 226 | 4,208(5.37%)#4 | 1,203,841(0.02%)#577 |
| 5. | Jefferson City | 223 | 4,208(5.30%)#5 | 1,203,841(0.02%)#587 |
| 6. | St Louis | 192 | 4,208(4.56%)#6 | 1,203,841(0.02%)#660 |
| 7. | Old Jamestown | 182 | 4,208(4.33%)#7 | 1,203,841(0.02%)#697 |
| 8. | Columbia | 148 | 4,208(3.52%)#8 | 1,203,841(0.01%)#825 |
| 9. | Poplar Bluff | 113 | 4,208(2.69%)#9 | 1,203,841(0.01%)#1,022 |
| 10. | Hazelwood | 109 | 4,208(2.59%)#10 | 1,203,841(0.01%)#1,049 |
| 11. | Branson | 103 | 4,208(2.45%)#11 | 1,203,841(0.01%)#1,096 |
| 12. | Springfield | 90 | 4,208(2.14%)#12 | 1,203,841(0.01%)#1,204 |
| 13. | O Fallon | 82 | 4,208(1.95%)#13 | 1,203,841(0.01%)#1,304 |
| 14. | Mehlville | 79 | 4,208(1.88%)#14 | 1,203,841(0.01%)#1,327 |
| 15. | St Joseph | 78 | 4,208(1.85%)#15 | 1,203,841(0.01%)#1,340 |
| 16. | St Charles | 70 | 4,208(1.66%)#16 | 1,203,841(0.01%)#1,424 |
| 17. | Raymore | 60 | 4,208(1.43%)#17 | 1,203,841(0.00%)#1,572 |
| 18. | Independence | 57 | 4,208(1.35%)#18 | 1,203,841(0.00%)#1,620 |
| 19. | Clayton | 41 | 4,208(0.97%)#19 | 1,203,841(0.00%)#1,949 |
| 20. | Grandview | 39 | 4,208(0.93%)#20 | 1,203,841(0.00%)#1,996 |
| 21. | Brentwood | 37 | 4,208(0.88%)#21 | 1,203,841(0.00%)#2,051 |
| 22. | Republic | 34 | 4,208(0.81%)#22 | 1,203,841(0.00%)#2,128 |
| 23. | University City | 33 | 4,208(0.78%)#23 | 1,203,841(0.00%)#2,151 |
| 24. | Jennings | 33 | 4,208(0.78%)#24 | 1,203,841(0.00%)#2,170 |
| 25. | Kirkwood | 32 | 4,208(0.76%)#25 | 1,203,841(0.00%)#2,184 |
| 26. | Sedalia | 30 | 4,208(0.71%)#26 | 1,203,841(0.00%)#2,246 |
| 27. | Webster Groves | 26 | 4,208(0.62%)#27 | 1,203,841(0.00%)#2,397 |
| 28. | Ballwin | 23 | 4,208(0.55%)#28 | 1,203,841(0.00%)#2,499 |
| 29. | Richmond Heights | 18 | 4,208(0.43%)#29 | 1,203,841(0.00%)#2,766 |
| 30. | Licking | 18 | 4,208(0.43%)#30 | 1,203,841(0.00%)#2,780 |
| 31. | Lee S Summit | 17 | 4,208(0.40%)#31 | 1,203,841(0.00%)#2,787 |
| 32. | Oakville | 16 | 4,208(0.38%)#32 | 1,203,841(0.00%)#2,846 |
| 33. | Des Peres | 15 | 4,208(0.36%)#33 | 1,203,841(0.00%)#2,923 |
| 34. | Ava | 15 | 4,208(0.36%)#34 | 1,203,841(0.00%)#2,941 |
| 35. | Lemay | 14 | 4,208(0.33%)#35 | 1,203,841(0.00%)#2,980 |
| 36. | Normandy | 14 | 4,208(0.33%)#36 | 1,203,841(0.00%)#2,999 |
| 37. | Owensville | 14 | 4,208(0.33%)#37 | 1,203,841(0.00%)#3,011 |
| 38. | Slater | 14 | 4,208(0.33%)#38 | 1,203,841(0.00%)#3,021 |
| 39. | Webb City | 13 | 4,208(0.31%)#39 | 1,203,841(0.00%)#3,044 |
| 40. | Fulton | 13 | 4,208(0.31%)#40 | 1,203,841(0.00%)#3,046 |
| 41. | Duquesne | 13 | 4,208(0.31%)#41 | 1,203,841(0.00%)#3,074 |
| 42. | Pine Lawn | 12 | 4,208(0.29%)#42 | 1,203,841(0.00%)#3,148 |
| 43. | Blue Springs | 11 | 4,208(0.26%)#43 | 1,203,841(0.00%)#3,169 |
| 44. | Osage Beach | 10 | 4,208(0.24%)#44 | 1,203,841(0.00%)#3,297 |
| 45. | Knob Noster | 10 | 4,208(0.24%)#45 | 1,203,841(0.00%)#3,308 |
| 46. | Spanish Lake | 9 | 4,208(0.21%)#46 | 1,203,841(0.00%)#3,356 |
| 47. | Murphy | 9 | 4,208(0.21%)#47 | 1,203,841(0.00%)#3,373 |
| 48. | Sappington | 9 | 4,208(0.21%)#48 | 1,203,841(0.00%)#3,377 |
| 49. | Alba | 9 | 4,208(0.21%)#49 | 1,203,841(0.00%)#3,419 |
| 50. | Hannibal | 8 | 4,208(0.19%)#50 | 1,203,841(0.00%)#3,452 |
| 51. | Twin Oaks | 8 | 4,208(0.19%)#51 | 1,203,841(0.00%)#3,531 |
| 52. | Warrensburg | 6 | 4,208(0.14%)#52 | 1,203,841(0.00%)#3,644 |
| 53. | Bull Creek | 6 | 4,208(0.14%)#53 | 1,203,841(0.00%)#3,693 |
| 54. | Cameron | 5 | 4,208(0.12%)#54 | 1,203,841(0.00%)#3,718 |
| 55. | Bonne Terre | 5 | 4,208(0.12%)#55 | 1,203,841(0.00%)#3,722 |
| 56. | Vinita Park | 5 | 4,208(0.12%)#56 | 1,203,841(0.00%)#3,758 |
| 57. | Crystal Lakes | 4 | 4,208(0.10%)#57 | 1,203,841(0.00%)#3,883 |
| 58. | Purcell | 3 | 4,208(0.07%)#58 | 1,203,841(0.00%)#3,965 |
| 59. | Bowling Green | 2 | 4,208(0.05%)#59 | 1,203,841(0.00%)#3,999 |
| 60. | Saginaw | 2 | 4,208(0.05%)#60 | 1,203,841(0.00%)#4,055 |
| 61. | Kinloch | 2 | 4,208(0.05%)#61 | 1,203,841(0.00%)#4,057 |
| 62. | Oakwood Park | 2 | 4,208(0.05%)#62 | 1,203,841(0.00%)#4,059 |
| 63. | Tipton | 1 | 4,208(0.02%)#63 | 1,203,841(0.00%)#4,112 |
| 64. | Lanagan | 1 | 4,208(0.02%)#64 | 1,203,841(0.00%)#4,141 |
| 65. | Laredo | 1 | 4,208(0.02%)#65 | 1,203,841(0.00%)#4,148 |
Common Questions
What are the Top 10 Cities with the Largest Jamaican Community in Missouri?
Top 10 Cities with the Largest Jamaican Community in Missouri are:
#1
763
#2
321
#3
268
#4
226
#5
223
#6
192
#7
182
#8
148
#9
113
#10
109
What city has the Largest Jamaican Community in Missouri?
Kansas City has the Largest Jamaican Community in Missouri with 763.
What is the Total Jamaican Population in the State of Missouri?
Total Jamaican Population in Missouri is 4,208.
What is the Total Jamaican Population in the United States?
Total Jamaican Population in the United States is 1,203,841.