Cities with the Highest Percentage of Bangladeshi Population in the United States
RELATED REPORTS & OPTIONS
Bangladeshi
United States
Compare Cities
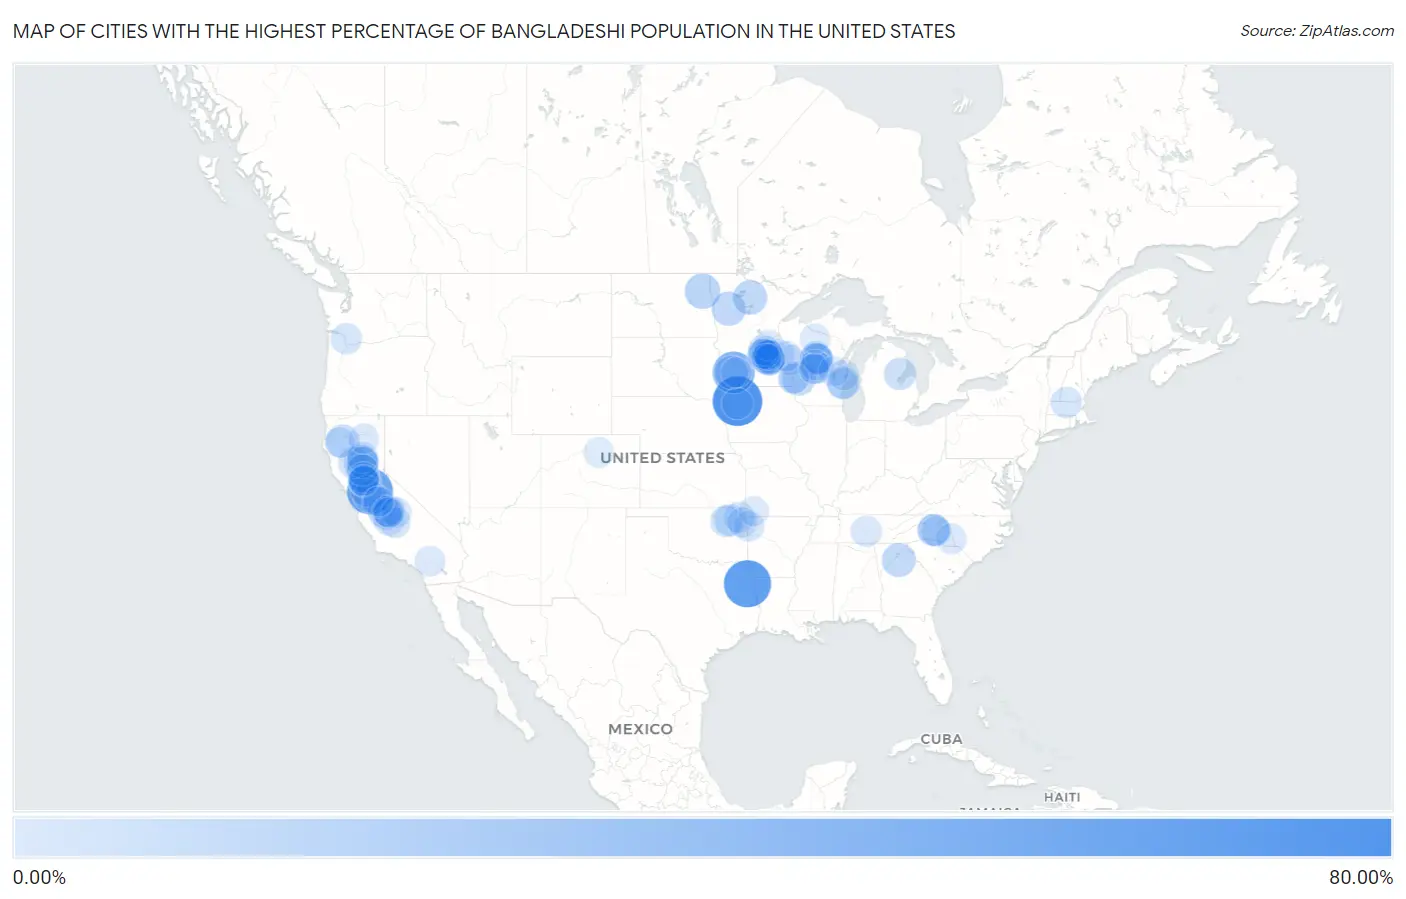
Map of Cities with the Highest Percentage of Bangladeshi Population in the United States
0.00%
80.00%
Cities with the Highest Percentage of Bangladeshi Population in the United States
| City | Bangladeshi | vs State | vs National | |
| 1. | Truesdale | 65.25% | 0.040%(+65.2)#1 | 0.11%(+65.1)#1 |
| 2. | Nesbitt | 57.62% | 0.011%(+57.6)#1 | 0.11%(+57.5)#2 |
| 3. | Farmington | 53.15% | 0.28%(+52.9)#1 | 0.11%(+53.0)#3 |
| 4. | Walnut Grove | 40.74% | 1.72%(+39.0)#1 | 0.11%(+40.6)#4 |
| 5. | Baron | 24.36% | 0.18%(+24.2)#1 | 0.11%(+24.3)#5 |
| 6. | Inkster | 19.23% | 0.0054%(+19.2)#1 | 0.11%(+19.1)#6 |
| 7. | Cincinnati | 18.74% | 0.071%(+18.7)#1 | 0.11%(+18.6)#7 |
| 8. | Franklin Cdp Merced County | 18.23% | 0.28%(+17.9)#2 | 0.11%(+18.1)#8 |
| 9. | Thermalito | 16.48% | 0.28%(+16.2)#3 | 0.11%(+16.4)#9 |
| 10. | Northome | 15.74% | 1.72%(+14.0)#2 | 0.11%(+15.6)#10 |
| 11. | Midway | 15.62% | 1.72%(+13.9)#3 | 0.11%(+15.5)#11 |
| 12. | Maplewood | 15.39% | 1.72%(+13.7)#4 | 0.11%(+15.3)#12 |
| 13. | Carl | 14.53% | 0.052%(+14.5)#1 | 0.11%(+14.4)#13 |
| 14. | North St Paul | 13.81% | 1.72%(+12.1)#5 | 0.11%(+13.7)#14 |
| 15. | Rockland | 13.75% | 0.99%(+12.8)#1 | 0.11%(+13.6)#15 |
| 16. | Tracy | 13.26% | 1.72%(+11.5)#6 | 0.11%(+13.2)#16 |
| 17. | Brooklyn Park | 12.76% | 1.72%(+11.0)#7 | 0.11%(+12.7)#17 |
| 18. | Douglas City | 12.60% | 0.28%(+12.3)#4 | 0.11%(+12.5)#18 |
| 19. | St Paul | 11.27% | 1.72%(+9.56)#8 | 0.11%(+11.2)#19 |
| 20. | Florin | 10.74% | 0.28%(+10.5)#5 | 0.11%(+10.6)#20 |
| 21. | Lemon Hill | 10.26% | 0.28%(+9.98)#6 | 0.11%(+10.2)#21 |
| 22. | Tarpey Village | 10.22% | 0.28%(+9.94)#7 | 0.11%(+10.1)#22 |
| 23. | Sheboygan | 10.04% | 0.99%(+9.05)#2 | 0.11%(+9.94)#23 |
| 24. | Linda | 9.94% | 0.28%(+9.66)#8 | 0.11%(+9.84)#24 |
| 25. | Brooklyn Center | 9.90% | 1.72%(+8.19)#9 | 0.11%(+9.80)#25 |
| 26. | Oakdale | 9.89% | 1.72%(+8.17)#10 | 0.11%(+9.78)#26 |
| 27. | Rouse | 9.77% | 0.28%(+9.49)#9 | 0.11%(+9.67)#27 |
| 28. | Turner | 9.46% | 0.077%(+9.38)#1 | 0.11%(+9.35)#28 |
| 29. | Long View | 9.39% | 0.13%(+9.25)#1 | 0.11%(+9.28)#29 |
| 30. | Wausau | 9.06% | 0.99%(+8.07)#3 | 0.11%(+8.96)#30 |
| 31. | Rothschild | 9.01% | 0.99%(+8.02)#4 | 0.11%(+8.91)#31 |
| 32. | Biola | 8.76% | 0.28%(+8.48)#10 | 0.11%(+8.66)#32 |
| 33. | Newport | 8.50% | 1.72%(+6.79)#11 | 0.11%(+8.40)#33 |
| 34. | Oroville | 8.19% | 0.28%(+7.91)#11 | 0.11%(+8.09)#34 |
| 35. | Limestone | 8.10% | 0.18%(+7.92)#2 | 0.11%(+8.00)#35 |
| 36. | Little Canada | 8.06% | 1.72%(+6.34)#12 | 0.11%(+7.95)#36 |
| 37. | Turley | 7.95% | 0.18%(+7.77)#3 | 0.11%(+7.85)#37 |
| 38. | Rib Mountain | 7.56% | 0.99%(+6.56)#5 | 0.11%(+7.45)#38 |
| 39. | Hildebran | 7.43% | 0.13%(+7.30)#2 | 0.11%(+7.33)#39 |
| 40. | West Park | 7.40% | 0.28%(+7.12)#12 | 0.11%(+7.30)#40 |
| 41. | Willows | 7.26% | 0.28%(+6.97)#13 | 0.11%(+7.15)#41 |
| 42. | Storm Lake | 6.81% | 0.040%(+6.77)#2 | 0.11%(+6.70)#42 |
| 43. | St Paul Park | 6.71% | 1.72%(+5.00)#13 | 0.11%(+6.61)#43 |
| 44. | Whiting | 6.70% | 0.99%(+5.70)#6 | 0.11%(+6.59)#44 |
| 45. | South Oroville | 6.50% | 0.28%(+6.22)#14 | 0.11%(+6.40)#45 |
| 46. | Winchendon | 6.50% | 0.022%(+6.48)#1 | 0.11%(+6.40)#46 |
| 47. | La Center | 6.46% | 0.062%(+6.40)#1 | 0.11%(+6.35)#47 |
| 48. | Taft Mosswood | 6.38% | 0.28%(+6.10)#15 | 0.11%(+6.28)#48 |
| 49. | Olivehurst | 6.35% | 0.28%(+6.07)#16 | 0.11%(+6.25)#49 |
| 50. | Gibbsville | 6.27% | 0.99%(+5.28)#7 | 0.11%(+6.17)#50 |
| 51. | Emerald | 6.12% | 0.99%(+5.13)#8 | 0.11%(+6.02)#51 |
| 52. | Spring Lake Park | 5.91% | 1.72%(+4.20)#14 | 0.11%(+5.81)#52 |
| 53. | Armona | 5.72% | 0.28%(+5.44)#17 | 0.11%(+5.62)#53 |
| 54. | Merced | 5.54% | 0.28%(+5.25)#18 | 0.11%(+5.43)#54 |
| 55. | Lakewood Park | 5.51% | 0.0086%(+5.51)#1 | 0.11%(+5.41)#55 |
| 56. | Pensacola | 5.45% | 0.18%(+5.27)#4 | 0.11%(+5.35)#56 |
| 57. | Holmen | 5.42% | 0.99%(+4.43)#9 | 0.11%(+5.32)#57 |
| 58. | East Tulare Villa | 5.34% | 0.28%(+5.05)#19 | 0.11%(+5.23)#58 |
| 59. | Concow | 5.33% | 0.28%(+5.04)#20 | 0.11%(+5.22)#59 |
| 60. | Biron | 5.28% | 0.99%(+4.29)#10 | 0.11%(+5.18)#60 |
| 61. | Elverta | 5.21% | 0.28%(+4.93)#21 | 0.11%(+5.11)#61 |
| 62. | Vadnais Heights | 5.17% | 1.72%(+3.45)#15 | 0.11%(+5.06)#62 |
| 63. | Fresno | 4.97% | 0.28%(+4.68)#22 | 0.11%(+4.86)#63 |
| 64. | Cottage Grove | 4.93% | 1.72%(+3.21)#16 | 0.11%(+4.82)#64 |
| 65. | Weston | 4.82% | 0.99%(+3.82)#11 | 0.11%(+4.71)#65 |
| 66. | Norwood | 4.71% | 0.13%(+4.58)#3 | 0.11%(+4.61)#66 |
| 67. | Bayview Cdp Humboldt County | 4.63% | 0.28%(+4.35)#23 | 0.11%(+4.53)#67 |
| 68. | Lincoln | 4.61% | 0.071%(+4.54)#2 | 0.11%(+4.51)#68 |
| 69. | Mounds View | 4.56% | 1.72%(+2.85)#17 | 0.11%(+4.46)#69 |
| 70. | Oak Grove | 4.48% | 1.72%(+2.76)#18 | 0.11%(+4.37)#70 |
| 71. | Akron Borough | 4.35% | 0.014%(+4.34)#1 | 0.11%(+4.25)#71 |
| 72. | Hat Creek | 4.23% | 0.28%(+3.94)#24 | 0.11%(+4.12)#72 |
| 73. | Cabazon | 4.21% | 0.28%(+3.93)#25 | 0.11%(+4.11)#73 |
| 74. | Manitowoc | 4.18% | 0.99%(+3.18)#12 | 0.11%(+4.07)#74 |
| 75. | Parkway | 4.17% | 0.28%(+3.89)#26 | 0.11%(+4.07)#75 |
| 76. | Eau Claire | 4.15% | 0.99%(+3.16)#13 | 0.11%(+4.05)#76 |
| 77. | Squaw Valley | 4.14% | 0.28%(+3.85)#27 | 0.11%(+4.03)#77 |
| 78. | Sunnyside | 4.12% | 0.28%(+3.83)#28 | 0.11%(+4.01)#78 |
| 79. | Junction City | 4.10% | 0.99%(+3.11)#14 | 0.11%(+4.00)#79 |
| 80. | Oaks | 3.97% | 0.18%(+3.79)#5 | 0.11%(+3.87)#80 |
| 81. | Onalaska | 3.97% | 0.99%(+2.98)#15 | 0.11%(+3.87)#81 |
| 82. | Dacono | 3.96% | 0.086%(+3.88)#1 | 0.11%(+3.86)#82 |
| 83. | Appleton | 3.95% | 0.99%(+2.95)#16 | 0.11%(+3.84)#83 |
| 84. | Hayfork | 3.90% | 0.28%(+3.62)#29 | 0.11%(+3.80)#84 |
| 85. | Harris | 3.90% | 1.72%(+2.18)#19 | 0.11%(+3.79)#85 |
| 86. | Colfax | 3.88% | 0.99%(+2.89)#17 | 0.11%(+3.78)#86 |
| 87. | Minocqua | 3.87% | 0.99%(+2.88)#18 | 0.11%(+3.77)#87 |
| 88. | Lamberton | 3.86% | 1.72%(+2.15)#20 | 0.11%(+3.76)#88 |
| 89. | Ham Lake | 3.73% | 1.72%(+2.01)#21 | 0.11%(+3.62)#89 |
| 90. | University Of California Merced | 3.71% | 0.28%(+3.42)#30 | 0.11%(+3.60)#90 |
| 91. | Centerville | 3.70% | 1.72%(+1.99)#22 | 0.11%(+3.60)#91 |
| 92. | Newton | 3.60% | 0.13%(+3.47)#4 | 0.11%(+3.49)#92 |
| 93. | Greenville | 3.59% | 0.99%(+2.60)#19 | 0.11%(+3.49)#93 |
| 94. | Woodbury | 3.58% | 1.72%(+1.87)#23 | 0.11%(+3.48)#94 |
| 95. | Wisconsin Rapids | 3.57% | 0.99%(+2.57)#20 | 0.11%(+3.46)#95 |
| 96. | Coon Rapids | 3.55% | 1.72%(+1.83)#24 | 0.11%(+3.44)#96 |
| 97. | White Bear Lake | 3.52% | 1.72%(+1.81)#25 | 0.11%(+3.42)#97 |
| 98. | Mendota | 3.52% | 1.72%(+1.80)#26 | 0.11%(+3.42)#98 |
| 99. | Fruitridge Pocket | 3.52% | 0.28%(+3.24)#31 | 0.11%(+3.42)#99 |
| 100. | Fairview | 3.52% | 0.023%(+3.49)#1 | 0.11%(+3.41)#100 |
Common Questions
What are the Top 10 Cities with the Highest Percentage of Bangladeshi Population in the United States?
Top 10 Cities with the Highest Percentage of Bangladeshi Population in the United States are:
What city has the Highest Percentage of Bangladeshi Population in the United States?
Truesdale has the Highest Percentage of Bangladeshi Population in the United States with 65.25%.
What is the Percentage of Bangladeshi Population in the United States?
Percentage of Bangladeshi Population in the United States is 0.11%.