Cities with the Most Immigrants from Northern Europe in Georgia
RELATED REPORTS & OPTIONS
Northern Europe
Georgia
Compare Cities
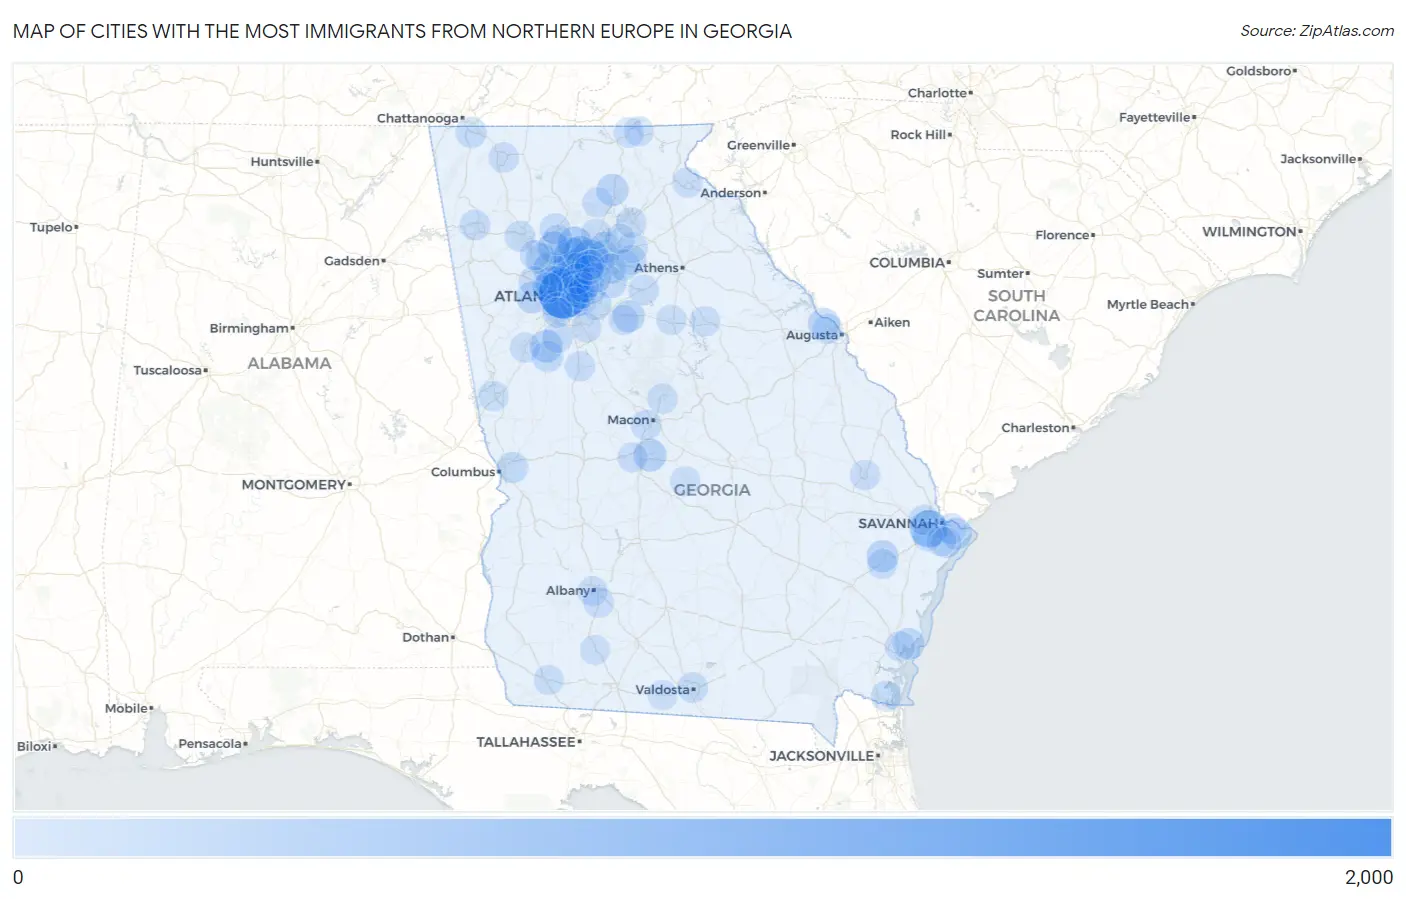
Map of Cities with the Most Immigrants from Northern Europe in Georgia
0
2,000
Cities with the Most Immigrants from Northern Europe in Georgia
| City | Northern Europe | vs State | vs National | |
| 1. | Atlanta | 1,587 | 23,028(6.89%)#1 | 944,917(0.17%)#36 |
| 2. | Sandy Springs | 654 | 23,028(2.84%)#2 | 944,917(0.07%)#153 |
| 3. | Savannah | 591 | 23,028(2.57%)#3 | 944,917(0.06%)#172 |
| 4. | Roswell | 563 | 23,028(2.44%)#4 | 944,917(0.06%)#181 |
| 5. | Johns Creek | 481 | 23,028(2.09%)#5 | 944,917(0.05%)#207 |
| 6. | Brookhaven | 449 | 23,028(1.95%)#6 | 944,917(0.05%)#230 |
| 7. | Athens-Clarke County Unified Government (Balance) | 448 | 23,028(1.95%)#7 | 944,917(0.05%)#232 |
| 8. | Milton | 335 | 23,028(1.45%)#8 | 944,917(0.04%)#353 |
| 9. | Dunwoody | 297 | 23,028(1.29%)#9 | 944,917(0.03%)#408 |
| 10. | Alpharetta | 264 | 23,028(1.15%)#10 | 944,917(0.03%)#488 |
| 11. | Marietta | 246 | 23,028(1.07%)#11 | 944,917(0.03%)#539 |
| 12. | Smyrna | 239 | 23,028(1.04%)#12 | 944,917(0.03%)#565 |
| 13. | Warner Robins | 234 | 23,028(1.02%)#13 | 944,917(0.02%)#583 |
| 14. | Peachtree City | 201 | 23,028(0.87%)#14 | 944,917(0.02%)#699 |
| 15. | Augusta-Richmond County Consolidated Government (Balance) | 166 | 23,028(0.72%)#15 | 944,917(0.02%)#840 |
| 16. | Douglasville | 163 | 23,028(0.71%)#16 | 944,917(0.02%)#867 |
| 17. | Woodstock | 163 | 23,028(0.71%)#17 | 944,917(0.02%)#868 |
| 18. | Dahlonega | 158 | 23,028(0.69%)#18 | 944,917(0.02%)#905 |
| 19. | Peachtree Corners | 154 | 23,028(0.67%)#19 | 944,917(0.02%)#932 |
| 20. | Evans | 152 | 23,028(0.66%)#20 | 944,917(0.02%)#948 |
| 21. | Hinesville | 150 | 23,028(0.65%)#21 | 944,917(0.02%)#956 |
| 22. | Covington | 150 | 23,028(0.65%)#22 | 944,917(0.02%)#961 |
| 23. | Druid Hills | 144 | 23,028(0.63%)#23 | 944,917(0.02%)#996 |
| 24. | Decatur | 130 | 23,028(0.56%)#24 | 944,917(0.01%)#1,113 |
| 25. | Wilmington Island | 126 | 23,028(0.55%)#25 | 944,917(0.01%)#1,145 |
| 26. | North Druid Hills | 125 | 23,028(0.54%)#26 | 944,917(0.01%)#1,157 |
| 27. | Duluth | 120 | 23,028(0.52%)#27 | 944,917(0.01%)#1,193 |
| 28. | St Simons | 120 | 23,028(0.52%)#28 | 944,917(0.01%)#1,200 |
| 29. | Senoia | 115 | 23,028(0.50%)#29 | 944,917(0.01%)#1,256 |
| 30. | Sugar Hill | 107 | 23,028(0.46%)#30 | 944,917(0.01%)#1,338 |
| 31. | Columbus | 104 | 23,028(0.45%)#31 | 944,917(0.01%)#1,373 |
| 32. | Kennesaw | 100 | 23,028(0.43%)#32 | 944,917(0.01%)#1,441 |
| 33. | Snellville | 93 | 23,028(0.40%)#33 | 944,917(0.01%)#1,552 |
| 34. | Dacula | 93 | 23,028(0.40%)#34 | 944,917(0.01%)#1,559 |
| 35. | Fort Oglethorpe | 84 | 23,028(0.36%)#35 | 944,917(0.01%)#1,698 |
| 36. | Canton | 66 | 23,028(0.29%)#36 | 944,917(0.01%)#2,026 |
| 37. | Vinings | 66 | 23,028(0.29%)#37 | 944,917(0.01%)#2,036 |
| 38. | Valdosta | 63 | 23,028(0.27%)#38 | 944,917(0.01%)#2,094 |
| 39. | Macon Bibb County | 61 | 23,028(0.26%)#39 | 944,917(0.01%)#2,159 |
| 40. | Whitemarsh Island | 60 | 23,028(0.26%)#40 | 944,917(0.01%)#2,212 |
| 41. | Cartersville | 59 | 23,028(0.26%)#41 | 944,917(0.01%)#2,229 |
| 42. | St Marys | 56 | 23,028(0.24%)#42 | 944,917(0.01%)#2,330 |
| 43. | North Decatur | 55 | 23,028(0.24%)#43 | 944,917(0.01%)#2,361 |
| 44. | Rome | 54 | 23,028(0.23%)#44 | 944,917(0.01%)#2,381 |
| 45. | Skidaway Island | 54 | 23,028(0.23%)#45 | 944,917(0.01%)#2,404 |
| 46. | Candler Mcafee | 51 | 23,028(0.22%)#46 | 944,917(0.01%)#2,506 |
| 47. | Fayetteville | 50 | 23,028(0.22%)#47 | 944,917(0.01%)#2,544 |
| 48. | Stonecrest | 49 | 23,028(0.21%)#48 | 944,917(0.01%)#2,567 |
| 49. | Stone Mountain | 49 | 23,028(0.21%)#49 | 944,917(0.01%)#2,592 |
| 50. | Suwanee | 47 | 23,028(0.20%)#50 | 944,917(0.00%)#2,647 |
| 51. | Braselton | 47 | 23,028(0.20%)#51 | 944,917(0.00%)#2,651 |
| 52. | Monroe | 46 | 23,028(0.20%)#52 | 944,917(0.00%)#2,688 |
| 53. | Pooler | 44 | 23,028(0.19%)#53 | 944,917(0.00%)#2,765 |
| 54. | Lawrenceville | 41 | 23,028(0.18%)#54 | 944,917(0.00%)#2,887 |
| 55. | Powder Springs | 38 | 23,028(0.17%)#55 | 944,917(0.00%)#3,028 |
| 56. | Avondale Estates | 36 | 23,028(0.16%)#56 | 944,917(0.00%)#3,157 |
| 57. | Putney | 35 | 23,028(0.15%)#57 | 944,917(0.00%)#3,201 |
| 58. | Tucker | 34 | 23,028(0.15%)#58 | 944,917(0.00%)#3,213 |
| 59. | Chamblee | 34 | 23,028(0.15%)#59 | 944,917(0.00%)#3,216 |
| 60. | Holly Springs | 34 | 23,028(0.15%)#60 | 944,917(0.00%)#3,231 |
| 61. | Young Harris | 33 | 23,028(0.14%)#61 | 944,917(0.00%)#3,345 |
| 62. | Lilburn | 31 | 23,028(0.13%)#62 | 944,917(0.00%)#3,427 |
| 63. | Newnan | 29 | 23,028(0.13%)#63 | 944,917(0.00%)#3,536 |
| 64. | Dalton | 29 | 23,028(0.13%)#64 | 944,917(0.00%)#3,537 |
| 65. | Madison | 29 | 23,028(0.13%)#65 | 944,917(0.00%)#3,582 |
| 66. | Martinez | 27 | 23,028(0.12%)#66 | 944,917(0.00%)#3,669 |
| 67. | Auburn | 27 | 23,028(0.12%)#67 | 944,917(0.00%)#3,703 |
| 68. | Mableton | 26 | 23,028(0.11%)#68 | 944,917(0.00%)#3,738 |
| 69. | Gainesville | 25 | 23,028(0.11%)#69 | 944,917(0.00%)#3,811 |
| 70. | Statesboro | 25 | 23,028(0.11%)#70 | 944,917(0.00%)#3,813 |
| 71. | Gresham Park | 25 | 23,028(0.11%)#71 | 944,917(0.00%)#3,850 |
| 72. | Dawsonville | 25 | 23,028(0.11%)#72 | 944,917(0.00%)#3,868 |
| 73. | Greensboro | 24 | 23,028(0.10%)#73 | 944,917(0.00%)#3,952 |
| 74. | Albany | 23 | 23,028(0.10%)#74 | 944,917(0.00%)#3,982 |
| 75. | Acworth | 23 | 23,028(0.10%)#75 | 944,917(0.00%)#3,992 |
| 76. | Clarkston | 23 | 23,028(0.10%)#76 | 944,917(0.00%)#4,003 |
| 77. | Cumming | 23 | 23,028(0.10%)#77 | 944,917(0.00%)#4,029 |
| 78. | Gray | 21 | 23,028(0.09%)#78 | 944,917(0.00%)#4,231 |
| 79. | East Point | 20 | 23,028(0.09%)#79 | 944,917(0.00%)#4,268 |
| 80. | Brunswick | 19 | 23,028(0.08%)#80 | 944,917(0.00%)#4,401 |
| 81. | Griffin | 18 | 23,028(0.08%)#81 | 944,917(0.00%)#4,489 |
| 82. | Porterdale | 18 | 23,028(0.08%)#82 | 944,917(0.00%)#4,598 |
| 83. | Toccoa | 17 | 23,028(0.07%)#83 | 944,917(0.00%)#4,652 |
| 84. | Berkeley Lake | 17 | 23,028(0.07%)#84 | 944,917(0.00%)#4,709 |
| 85. | Bainbridge | 15 | 23,028(0.07%)#85 | 944,917(0.00%)#4,887 |
| 86. | Lagrange | 14 | 23,028(0.06%)#86 | 944,917(0.00%)#5,019 |
| 87. | Stockbridge | 14 | 23,028(0.06%)#87 | 944,917(0.00%)#5,023 |
| 88. | College Park | 14 | 23,028(0.06%)#88 | 944,917(0.00%)#5,041 |
| 89. | Fort Valley | 14 | 23,028(0.06%)#89 | 944,917(0.00%)#5,057 |
| 90. | Montgomery | 14 | 23,028(0.06%)#90 | 944,917(0.00%)#5,097 |
| 91. | Walthourville | 14 | 23,028(0.06%)#91 | 944,917(0.00%)#5,108 |
| 92. | Kennesaw State University | 12 | 23,028(0.05%)#92 | 944,917(0.00%)#5,445 |
| 93. | Hiawassee | 12 | 23,028(0.05%)#93 | 944,917(0.00%)#5,496 |
| 94. | Norcross | 11 | 23,028(0.05%)#94 | 944,917(0.00%)#5,544 |
| 95. | Georgetown | 11 | 23,028(0.05%)#95 | 944,917(0.00%)#5,563 |
| 96. | Flowery Branch | 11 | 23,028(0.05%)#96 | 944,917(0.00%)#5,579 |
| 97. | Fairfield Plantation | 11 | 23,028(0.05%)#97 | 944,917(0.00%)#5,599 |
| 98. | Cochran | 11 | 23,028(0.05%)#98 | 944,917(0.00%)#5,610 |
| 99. | Quitman | 11 | 23,028(0.05%)#99 | 944,917(0.00%)#5,625 |
| 100. | Pelham | 11 | 23,028(0.05%)#100 | 944,917(0.00%)#5,631 |
Common Questions
What are the Top 10 Cities with the Most Immigrants from Northern Europe in Georgia?
Top 10 Cities with the Most Immigrants from Northern Europe in Georgia are:
#1
1,587
#2
654
#3
591
#4
563
#5
481
#6
449
#7
335
#8
297
#9
264
#10
246
What city has the Most Immigrants from Northern Europe in Georgia?
Atlanta has the Most Immigrants from Northern Europe in Georgia with 1,587.
What is the Total Immigrants from Northern Europe in the State of Georgia?
Total Immigrants from Northern Europe in Georgia is 23,028.
What is the Total Immigrants from Northern Europe in the United States?
Total Immigrants from Northern Europe in the United States is 944,917.