Cities with the Most Immigrants from Northern Europe in Colorado
RELATED REPORTS & OPTIONS
Northern Europe
Colorado
Compare Cities
Map of Cities with the Most Immigrants from Northern Europe in Colorado
0
2,500
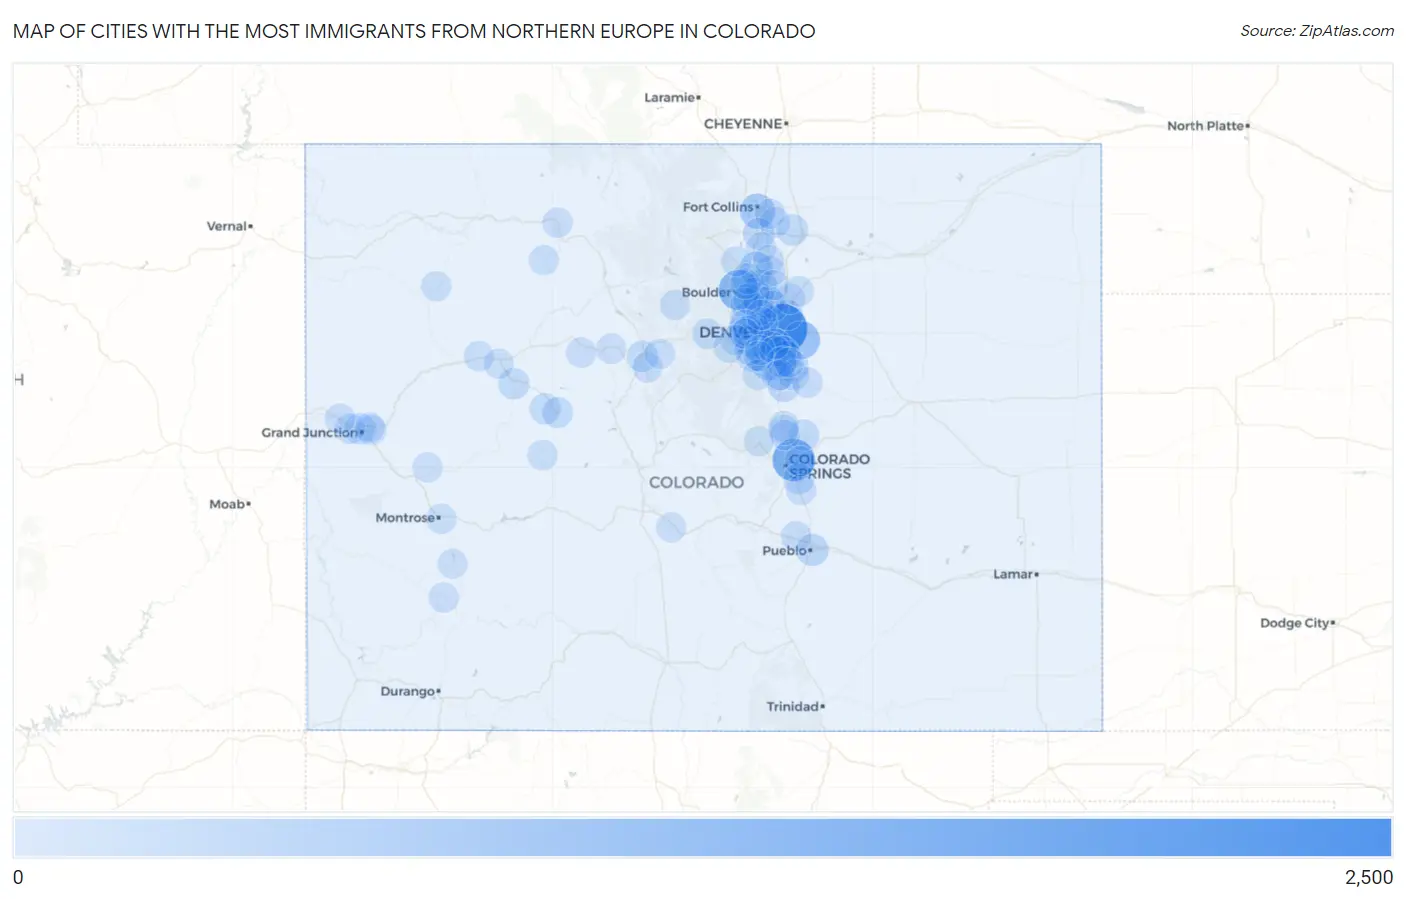
Cities with the Most Immigrants from Northern Europe in Colorado
| City | Northern Europe | vs State | vs National | |
| 1. | Denver | 2,248 | 17,868(12.58%)#1 | 944,917(0.24%)#20 |
| 2. | Colorado Springs | 1,390 | 17,868(7.78%)#2 | 944,917(0.15%)#43 |
| 3. | Boulder | 1,143 | 17,868(6.40%)#3 | 944,917(0.12%)#66 |
| 4. | Aurora | 843 | 17,868(4.72%)#4 | 944,917(0.09%)#106 |
| 5. | Highlands Ranch | 597 | 17,868(3.34%)#5 | 944,917(0.06%)#171 |
| 6. | Fort Collins | 576 | 17,868(3.22%)#6 | 944,917(0.06%)#178 |
| 7. | Lakewood | 436 | 17,868(2.44%)#7 | 944,917(0.05%)#241 |
| 8. | Longmont | 399 | 17,868(2.23%)#8 | 944,917(0.04%)#284 |
| 9. | Centennial | 362 | 17,868(2.03%)#9 | 944,917(0.04%)#330 |
| 10. | Westminster | 299 | 17,868(1.67%)#10 | 944,917(0.03%)#403 |
| 11. | Arvada | 276 | 17,868(1.54%)#11 | 944,917(0.03%)#455 |
| 12. | Erie | 247 | 17,868(1.38%)#12 | 944,917(0.03%)#535 |
| 13. | Northglenn | 236 | 17,868(1.32%)#13 | 944,917(0.02%)#576 |
| 14. | Broomfield | 232 | 17,868(1.30%)#14 | 944,917(0.02%)#588 |
| 15. | Lafayette | 228 | 17,868(1.28%)#15 | 944,917(0.02%)#602 |
| 16. | Pueblo | 218 | 17,868(1.22%)#16 | 944,917(0.02%)#640 |
| 17. | Parker | 215 | 17,868(1.20%)#17 | 944,917(0.02%)#649 |
| 18. | Castle Rock | 190 | 17,868(1.06%)#18 | 944,917(0.02%)#734 |
| 19. | Superior | 190 | 17,868(1.06%)#19 | 944,917(0.02%)#736 |
| 20. | Loveland | 174 | 17,868(0.97%)#20 | 944,917(0.02%)#795 |
| 21. | Littleton | 165 | 17,868(0.92%)#21 | 944,917(0.02%)#849 |
| 22. | Ken Caryl | 159 | 17,868(0.89%)#22 | 944,917(0.02%)#894 |
| 23. | Golden | 159 | 17,868(0.89%)#23 | 944,917(0.02%)#896 |
| 24. | Greeley | 156 | 17,868(0.87%)#24 | 944,917(0.02%)#913 |
| 25. | Carbondale | 133 | 17,868(0.74%)#25 | 944,917(0.01%)#1,088 |
| 26. | Grand Junction | 132 | 17,868(0.74%)#26 | 944,917(0.01%)#1,090 |
| 27. | Frisco | 132 | 17,868(0.74%)#27 | 944,917(0.01%)#1,098 |
| 28. | Thornton | 126 | 17,868(0.71%)#28 | 944,917(0.01%)#1,140 |
| 29. | Wheat Ridge | 126 | 17,868(0.71%)#29 | 944,917(0.01%)#1,143 |
| 30. | Black Forest | 126 | 17,868(0.71%)#30 | 944,917(0.01%)#1,147 |
| 31. | Englewood | 116 | 17,868(0.65%)#31 | 944,917(0.01%)#1,232 |
| 32. | Snowmass Village | 113 | 17,868(0.63%)#32 | 944,917(0.01%)#1,277 |
| 33. | Niwot | 110 | 17,868(0.62%)#33 | 944,917(0.01%)#1,313 |
| 34. | Dove Valley | 105 | 17,868(0.59%)#34 | 944,917(0.01%)#1,371 |
| 35. | Aspen | 104 | 17,868(0.58%)#35 | 944,917(0.01%)#1,381 |
| 36. | Dakota Ridge | 96 | 17,868(0.54%)#36 | 944,917(0.01%)#1,505 |
| 37. | Security Widefield | 95 | 17,868(0.53%)#37 | 944,917(0.01%)#1,521 |
| 38. | Woodmoor | 84 | 17,868(0.47%)#38 | 944,917(0.01%)#1,700 |
| 39. | Louisville | 75 | 17,868(0.42%)#39 | 944,917(0.01%)#1,838 |
| 40. | Cherry Creek | 73 | 17,868(0.41%)#40 | 944,917(0.01%)#1,881 |
| 41. | Firestone | 69 | 17,868(0.39%)#41 | 944,917(0.01%)#1,969 |
| 42. | Cherry Hills Village | 69 | 17,868(0.39%)#42 | 944,917(0.01%)#1,975 |
| 43. | Evergreen | 63 | 17,868(0.35%)#43 | 944,917(0.01%)#2,117 |
| 44. | Pueblo West | 60 | 17,868(0.34%)#44 | 944,917(0.01%)#2,198 |
| 45. | Greenwood Village | 58 | 17,868(0.32%)#45 | 944,917(0.01%)#2,268 |
| 46. | Idaho Springs | 58 | 17,868(0.32%)#46 | 944,917(0.01%)#2,278 |
| 47. | Gunbarrel | 57 | 17,868(0.32%)#47 | 944,917(0.01%)#2,306 |
| 48. | Windsor | 56 | 17,868(0.31%)#48 | 944,917(0.01%)#2,326 |
| 49. | Breckenridge | 55 | 17,868(0.31%)#49 | 944,917(0.01%)#2,372 |
| 50. | Vail | 55 | 17,868(0.31%)#50 | 944,917(0.01%)#2,373 |
| 51. | Berthoud | 54 | 17,868(0.30%)#51 | 944,917(0.01%)#2,401 |
| 52. | Meridian | 54 | 17,868(0.30%)#52 | 944,917(0.01%)#2,415 |
| 53. | The Pinery | 52 | 17,868(0.29%)#53 | 944,917(0.01%)#2,472 |
| 54. | Fountain | 51 | 17,868(0.29%)#54 | 944,917(0.01%)#2,500 |
| 55. | Castle Pines Village | 50 | 17,868(0.28%)#55 | 944,917(0.01%)#2,564 |
| 56. | Fairmount | 49 | 17,868(0.27%)#56 | 944,917(0.01%)#2,586 |
| 57. | Applewood | 48 | 17,868(0.27%)#57 | 944,917(0.01%)#2,626 |
| 58. | Genesee | 48 | 17,868(0.27%)#58 | 944,917(0.01%)#2,632 |
| 59. | Brighton | 47 | 17,868(0.26%)#59 | 944,917(0.00%)#2,638 |
| 60. | Edwards | 45 | 17,868(0.25%)#60 | 944,917(0.00%)#2,725 |
| 61. | Four Square Mile | 43 | 17,868(0.24%)#61 | 944,917(0.00%)#2,806 |
| 62. | Lone Tree | 43 | 17,868(0.24%)#62 | 944,917(0.00%)#2,813 |
| 63. | Telluride | 42 | 17,868(0.24%)#63 | 944,917(0.00%)#2,876 |
| 64. | Gleneagle | 41 | 17,868(0.23%)#64 | 944,917(0.00%)#2,899 |
| 65. | Holly Hills | 38 | 17,868(0.21%)#65 | 944,917(0.00%)#3,055 |
| 66. | Ponderosa Park | 37 | 17,868(0.21%)#66 | 944,917(0.00%)#3,100 |
| 67. | Mount Crested Butte | 36 | 17,868(0.20%)#67 | 944,917(0.00%)#3,166 |
| 68. | Commerce City | 35 | 17,868(0.20%)#68 | 944,917(0.00%)#3,170 |
| 69. | Berkley | 35 | 17,868(0.20%)#69 | 944,917(0.00%)#3,183 |
| 70. | Sterling Ranch | 35 | 17,868(0.20%)#70 | 944,917(0.00%)#3,205 |
| 71. | Roxborough Park | 34 | 17,868(0.19%)#71 | 944,917(0.00%)#3,249 |
| 72. | Cimarron Hills | 33 | 17,868(0.18%)#72 | 944,917(0.00%)#3,297 |
| 73. | Steamboat Springs | 32 | 17,868(0.18%)#73 | 944,917(0.00%)#3,370 |
| 74. | Castle Pines | 32 | 17,868(0.18%)#74 | 944,917(0.00%)#3,373 |
| 75. | Timnath | 31 | 17,868(0.17%)#75 | 944,917(0.00%)#3,449 |
| 76. | Montrose | 29 | 17,868(0.16%)#76 | 944,917(0.00%)#3,542 |
| 77. | Clifton | 29 | 17,868(0.16%)#77 | 944,917(0.00%)#3,544 |
| 78. | Meeker | 29 | 17,868(0.16%)#78 | 944,917(0.00%)#3,596 |
| 79. | Phippsburg | 29 | 17,868(0.16%)#79 | 944,917(0.00%)#3,604 |
| 80. | Redlands | 26 | 17,868(0.15%)#80 | 944,917(0.00%)#3,765 |
| 81. | New Castle | 25 | 17,868(0.14%)#81 | 944,917(0.00%)#3,863 |
| 82. | Mead | 24 | 17,868(0.13%)#82 | 944,917(0.00%)#3,944 |
| 83. | Dacono | 23 | 17,868(0.13%)#83 | 944,917(0.00%)#4,032 |
| 84. | Fruita | 22 | 17,868(0.12%)#84 | 944,917(0.00%)#4,104 |
| 85. | Glenwood Springs | 22 | 17,868(0.12%)#85 | 944,917(0.00%)#4,113 |
| 86. | Lyons | 22 | 17,868(0.12%)#86 | 944,917(0.00%)#4,163 |
| 87. | Keystone | 21 | 17,868(0.12%)#87 | 944,917(0.00%)#4,257 |
| 88. | Fraser | 20 | 17,868(0.11%)#88 | 944,917(0.00%)#4,370 |
| 89. | Lochbuie | 19 | 17,868(0.11%)#89 | 944,917(0.00%)#4,430 |
| 90. | Fruitvale | 18 | 17,868(0.10%)#90 | 944,917(0.00%)#4,531 |
| 91. | Shaw Heights | 18 | 17,868(0.10%)#91 | 944,917(0.00%)#4,542 |
| 92. | West Pleasant View | 18 | 17,868(0.10%)#92 | 944,917(0.00%)#4,543 |
| 93. | Monument | 17 | 17,868(0.10%)#93 | 944,917(0.00%)#4,644 |
| 94. | Orchard City | 16 | 17,868(0.09%)#94 | 944,917(0.00%)#4,814 |
| 95. | Ridgway | 16 | 17,868(0.09%)#95 | 944,917(0.00%)#4,846 |
| 96. | Bow Mar | 16 | 17,868(0.09%)#96 | 944,917(0.00%)#4,849 |
| 97. | Howard | 16 | 17,868(0.09%)#97 | 944,917(0.00%)#4,852 |
| 98. | Stonegate | 15 | 17,868(0.08%)#98 | 944,917(0.00%)#4,904 |
| 99. | Woodland Park | 15 | 17,868(0.08%)#99 | 944,917(0.00%)#4,915 |
| 100. | Columbine | 14 | 17,868(0.08%)#100 | 944,917(0.00%)#5,024 |
Common Questions
What are the Top 10 Cities with the Most Immigrants from Northern Europe in Colorado?
Top 10 Cities with the Most Immigrants from Northern Europe in Colorado are:
#1
2,248
#2
1,390
#3
1,143
#4
843
#5
597
#6
576
#7
436
#8
399
#9
362
#10
299
What city has the Most Immigrants from Northern Europe in Colorado?
Denver has the Most Immigrants from Northern Europe in Colorado with 2,248.
What is the Total Immigrants from Northern Europe in the State of Colorado?
Total Immigrants from Northern Europe in Colorado is 17,868.
What is the Total Immigrants from Northern Europe in the United States?
Total Immigrants from Northern Europe in the United States is 944,917.