Cities with the Most Immigrants from Northern Europe in Illinois
RELATED REPORTS & OPTIONS
Northern Europe
Illinois
Compare Cities
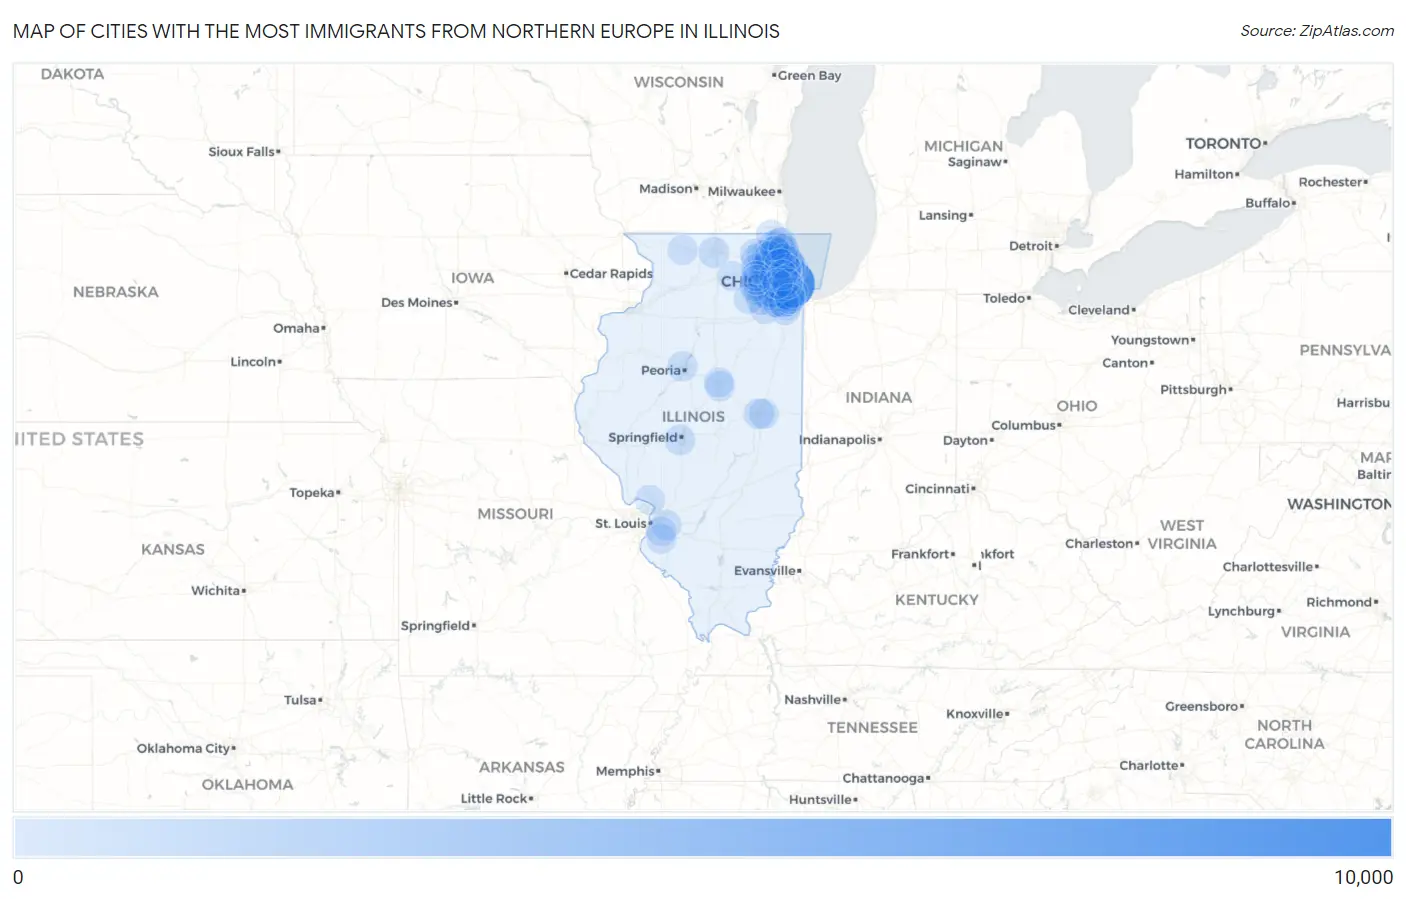
Map of Cities with the Most Immigrants from Northern Europe in Illinois
0
10,000
Cities with the Most Immigrants from Northern Europe in Illinois
| City | Northern Europe | vs State | vs National | |
| 1. | Chicago | 9,058 | 29,158(31.07%)#1 | 944,917(0.96%)#4 |
| 2. | Naperville | 1,271 | 29,158(4.36%)#2 | 944,917(0.13%)#51 |
| 3. | Evanston | 584 | 29,158(2.00%)#3 | 944,917(0.06%)#173 |
| 4. | Skokie | 474 | 29,158(1.63%)#4 | 944,917(0.05%)#211 |
| 5. | Oak Lawn | 427 | 29,158(1.46%)#5 | 944,917(0.05%)#254 |
| 6. | Rockford | 373 | 29,158(1.28%)#6 | 944,917(0.04%)#315 |
| 7. | Aurora | 336 | 29,158(1.15%)#7 | 944,917(0.04%)#351 |
| 8. | Orland Park | 309 | 29,158(1.06%)#8 | 944,917(0.03%)#386 |
| 9. | Champaign | 300 | 29,158(1.03%)#9 | 944,917(0.03%)#400 |
| 10. | Arlington Heights | 290 | 29,158(0.99%)#10 | 944,917(0.03%)#416 |
| 11. | Springfield | 270 | 29,158(0.93%)#11 | 944,917(0.03%)#467 |
| 12. | Park Ridge | 258 | 29,158(0.88%)#12 | 944,917(0.03%)#500 |
| 13. | Lake Forest | 245 | 29,158(0.84%)#13 | 944,917(0.03%)#543 |
| 14. | Wheaton | 244 | 29,158(0.84%)#14 | 944,917(0.03%)#547 |
| 15. | Schaumburg | 217 | 29,158(0.74%)#15 | 944,917(0.02%)#645 |
| 16. | Elmhurst | 216 | 29,158(0.74%)#16 | 944,917(0.02%)#646 |
| 17. | Long Grove | 214 | 29,158(0.73%)#17 | 944,917(0.02%)#652 |
| 18. | Tinley Park | 201 | 29,158(0.69%)#18 | 944,917(0.02%)#698 |
| 19. | Batavia | 185 | 29,158(0.63%)#19 | 944,917(0.02%)#761 |
| 20. | Winnetka | 172 | 29,158(0.59%)#20 | 944,917(0.02%)#812 |
| 21. | Hinsdale | 171 | 29,158(0.59%)#21 | 944,917(0.02%)#819 |
| 22. | Lombard | 169 | 29,158(0.58%)#22 | 944,917(0.02%)#828 |
| 23. | Barrington | 165 | 29,158(0.57%)#23 | 944,917(0.02%)#856 |
| 24. | Lisle | 164 | 29,158(0.56%)#24 | 944,917(0.02%)#861 |
| 25. | Joliet | 156 | 29,158(0.54%)#25 | 944,917(0.02%)#912 |
| 26. | Palos Park | 154 | 29,158(0.53%)#26 | 944,917(0.02%)#937 |
| 27. | Wilmette | 146 | 29,158(0.50%)#27 | 944,917(0.02%)#984 |
| 28. | Oak Park | 144 | 29,158(0.49%)#28 | 944,917(0.02%)#993 |
| 29. | Palatine | 143 | 29,158(0.49%)#29 | 944,917(0.02%)#999 |
| 30. | South Elgin | 140 | 29,158(0.48%)#30 | 944,917(0.01%)#1,028 |
| 31. | Buffalo Grove | 139 | 29,158(0.48%)#31 | 944,917(0.01%)#1,039 |
| 32. | Northbrook | 139 | 29,158(0.48%)#32 | 944,917(0.01%)#1,040 |
| 33. | Des Plaines | 136 | 29,158(0.47%)#33 | 944,917(0.01%)#1,060 |
| 34. | Mount Prospect | 134 | 29,158(0.46%)#34 | 944,917(0.01%)#1,077 |
| 35. | Glenview | 134 | 29,158(0.46%)#35 | 944,917(0.01%)#1,079 |
| 36. | Westmont | 130 | 29,158(0.45%)#36 | 944,917(0.01%)#1,114 |
| 37. | Western Springs | 130 | 29,158(0.45%)#37 | 944,917(0.01%)#1,116 |
| 38. | Hanover Park | 126 | 29,158(0.43%)#38 | 944,917(0.01%)#1,142 |
| 39. | Gurnee | 120 | 29,158(0.41%)#39 | 944,917(0.01%)#1,194 |
| 40. | Glencoe | 111 | 29,158(0.38%)#40 | 944,917(0.01%)#1,297 |
| 41. | O Fallon | 108 | 29,158(0.37%)#41 | 944,917(0.01%)#1,324 |
| 42. | Crystal Lake | 107 | 29,158(0.37%)#42 | 944,917(0.01%)#1,335 |
| 43. | Elk Grove Village | 107 | 29,158(0.37%)#43 | 944,917(0.01%)#1,336 |
| 44. | Lemont | 107 | 29,158(0.37%)#44 | 944,917(0.01%)#1,340 |
| 45. | Bloomingdale | 102 | 29,158(0.35%)#45 | 944,917(0.01%)#1,408 |
| 46. | Frankfort | 102 | 29,158(0.35%)#46 | 944,917(0.01%)#1,410 |
| 47. | Lockport | 100 | 29,158(0.34%)#47 | 944,917(0.01%)#1,444 |
| 48. | Urbana | 99 | 29,158(0.34%)#48 | 944,917(0.01%)#1,453 |
| 49. | Bolingbrook | 98 | 29,158(0.34%)#49 | 944,917(0.01%)#1,463 |
| 50. | Peoria | 97 | 29,158(0.33%)#50 | 944,917(0.01%)#1,478 |
| 51. | Streamwood | 97 | 29,158(0.33%)#51 | 944,917(0.01%)#1,483 |
| 52. | Inverness | 96 | 29,158(0.33%)#52 | 944,917(0.01%)#1,513 |
| 53. | Wheeling | 95 | 29,158(0.33%)#53 | 944,917(0.01%)#1,522 |
| 54. | Algonquin | 95 | 29,158(0.33%)#54 | 944,917(0.01%)#1,525 |
| 55. | Palos Hills | 95 | 29,158(0.33%)#55 | 944,917(0.01%)#1,530 |
| 56. | Downers Grove | 92 | 29,158(0.32%)#56 | 944,917(0.01%)#1,567 |
| 57. | Lake Barrington | 91 | 29,158(0.31%)#57 | 944,917(0.01%)#1,595 |
| 58. | Green Oaks | 91 | 29,158(0.31%)#58 | 944,917(0.01%)#1,596 |
| 59. | Hoffman Estates | 90 | 29,158(0.31%)#59 | 944,917(0.01%)#1,602 |
| 60. | Niles | 90 | 29,158(0.31%)#60 | 944,917(0.01%)#1,604 |
| 61. | Libertyville | 88 | 29,158(0.30%)#61 | 944,917(0.01%)#1,638 |
| 62. | Harwood Heights | 88 | 29,158(0.30%)#62 | 944,917(0.01%)#1,643 |
| 63. | Plainfield | 87 | 29,158(0.30%)#63 | 944,917(0.01%)#1,658 |
| 64. | Elgin | 84 | 29,158(0.29%)#64 | 944,917(0.01%)#1,686 |
| 65. | Woodridge | 84 | 29,158(0.29%)#65 | 944,917(0.01%)#1,691 |
| 66. | North Aurora | 83 | 29,158(0.28%)#66 | 944,917(0.01%)#1,707 |
| 67. | Oak Forest | 79 | 29,158(0.27%)#67 | 944,917(0.01%)#1,765 |
| 68. | Vernon Hills | 79 | 29,158(0.27%)#68 | 944,917(0.01%)#1,767 |
| 69. | Yorkville | 78 | 29,158(0.27%)#69 | 944,917(0.01%)#1,791 |
| 70. | Waukegan | 76 | 29,158(0.26%)#70 | 944,917(0.01%)#1,813 |
| 71. | Deerfield | 74 | 29,158(0.25%)#71 | 944,917(0.01%)#1,852 |
| 72. | Cary | 72 | 29,158(0.25%)#72 | 944,917(0.01%)#1,899 |
| 73. | Alsip | 71 | 29,158(0.24%)#73 | 944,917(0.01%)#1,919 |
| 74. | Bloomington | 70 | 29,158(0.24%)#74 | 944,917(0.01%)#1,936 |
| 75. | Morton Grove | 68 | 29,158(0.23%)#75 | 944,917(0.01%)#1,988 |
| 76. | Grayslake | 68 | 29,158(0.23%)#76 | 944,917(0.01%)#1,989 |
| 77. | Lake Zurich | 68 | 29,158(0.23%)#77 | 944,917(0.01%)#1,990 |
| 78. | Freeport | 67 | 29,158(0.23%)#78 | 944,917(0.01%)#2,010 |
| 79. | St Charles | 66 | 29,158(0.23%)#79 | 944,917(0.01%)#2,027 |
| 80. | Homer Glen | 66 | 29,158(0.23%)#80 | 944,917(0.01%)#2,031 |
| 81. | Evergreen Park | 66 | 29,158(0.23%)#81 | 944,917(0.01%)#2,033 |
| 82. | Addison | 65 | 29,158(0.22%)#82 | 944,917(0.01%)#2,053 |
| 83. | Highland Park | 64 | 29,158(0.22%)#83 | 944,917(0.01%)#2,074 |
| 84. | La Grange | 63 | 29,158(0.22%)#84 | 944,917(0.01%)#2,105 |
| 85. | Antioch | 62 | 29,158(0.21%)#85 | 944,917(0.01%)#2,139 |
| 86. | Mundelein | 60 | 29,158(0.21%)#86 | 944,917(0.01%)#2,199 |
| 87. | Lake Bluff | 60 | 29,158(0.21%)#87 | 944,917(0.01%)#2,214 |
| 88. | Dekalb | 59 | 29,158(0.20%)#88 | 944,917(0.01%)#2,226 |
| 89. | Prospect Heights | 57 | 29,158(0.20%)#89 | 944,917(0.01%)#2,298 |
| 90. | Forest Park | 57 | 29,158(0.20%)#90 | 944,917(0.01%)#2,299 |
| 91. | Orland Hills | 54 | 29,158(0.19%)#91 | 944,917(0.01%)#2,407 |
| 92. | Smithton | 53 | 29,158(0.18%)#92 | 944,917(0.01%)#2,446 |
| 93. | Godfrey | 52 | 29,158(0.18%)#93 | 944,917(0.01%)#2,465 |
| 94. | Berwyn | 51 | 29,158(0.17%)#94 | 944,917(0.01%)#2,494 |
| 95. | Normal | 51 | 29,158(0.17%)#95 | 944,917(0.01%)#2,495 |
| 96. | Belleville | 51 | 29,158(0.17%)#96 | 944,917(0.01%)#2,498 |
| 97. | Geneva | 51 | 29,158(0.17%)#97 | 944,917(0.01%)#2,508 |
| 98. | Schiller Park | 51 | 29,158(0.17%)#98 | 944,917(0.01%)#2,515 |
| 99. | Crestwood | 51 | 29,158(0.17%)#99 | 944,917(0.01%)#2,517 |
| 100. | Oak Brook | 51 | 29,158(0.17%)#100 | 944,917(0.01%)#2,523 |
Common Questions
What are the Top 10 Cities with the Most Immigrants from Northern Europe in Illinois?
Top 10 Cities with the Most Immigrants from Northern Europe in Illinois are:
#1
9,058
#2
1,271
#3
584
#4
474
#5
427
#6
373
#7
336
#8
309
#9
300
#10
290
What city has the Most Immigrants from Northern Europe in Illinois?
Chicago has the Most Immigrants from Northern Europe in Illinois with 9,058.
What is the Total Immigrants from Northern Europe in the State of Illinois?
Total Immigrants from Northern Europe in Illinois is 29,158.
What is the Total Immigrants from Northern Europe in the United States?
Total Immigrants from Northern Europe in the United States is 944,917.