Cities with the Most Immigrants from Northern Europe in Nebraska
RELATED REPORTS & OPTIONS
Northern Europe
Nebraska
Compare Cities
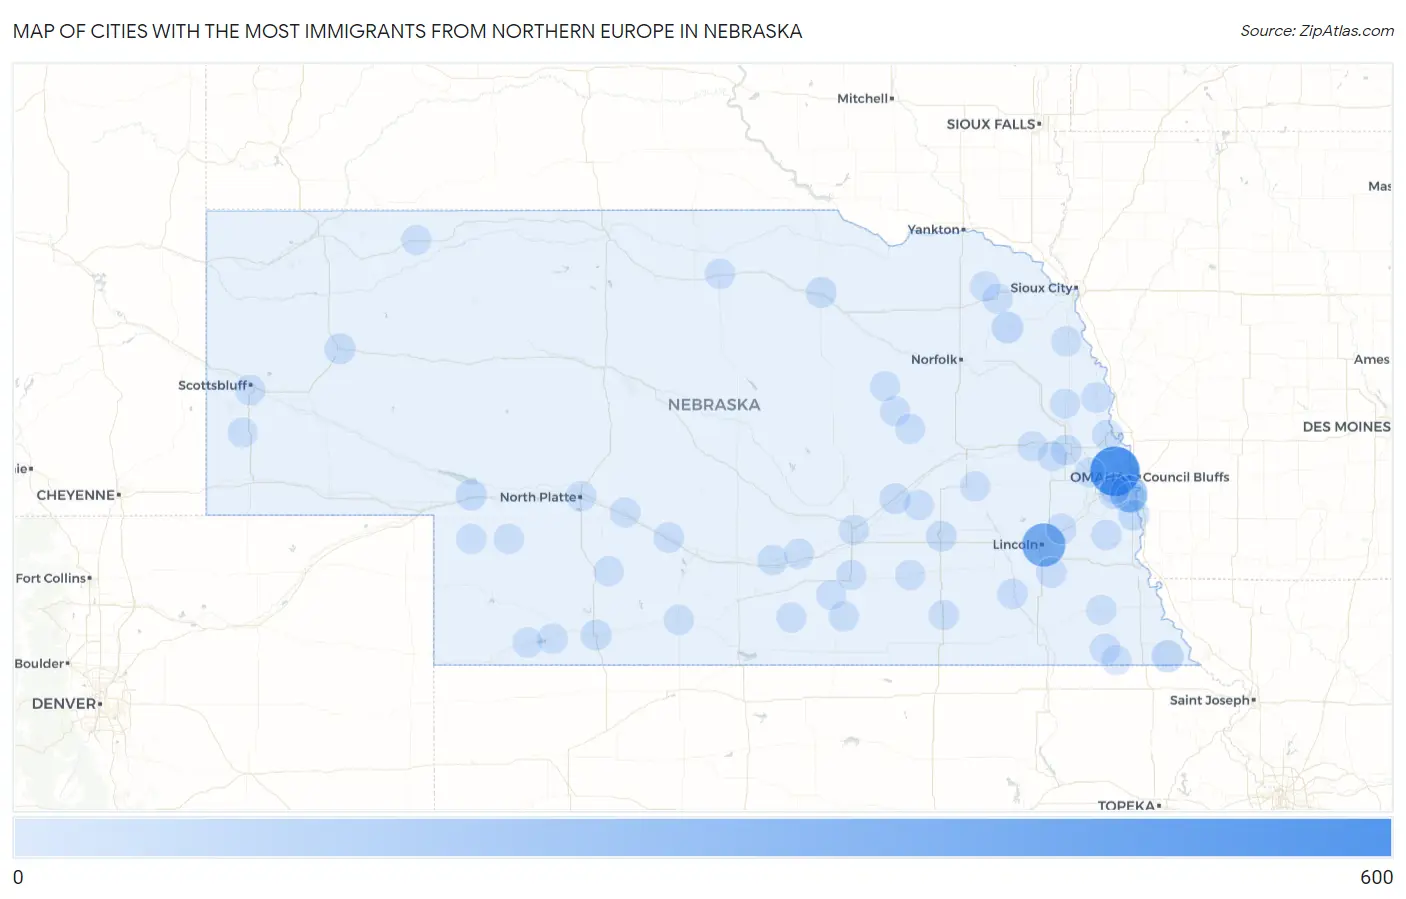
Map of Cities with the Most Immigrants from Northern Europe in Nebraska
0
600
Cities with the Most Immigrants from Northern Europe in Nebraska
| City | Northern Europe | vs State | vs National | |
| 1. | Omaha | 518 | 1,687(30.71%)#1 | 944,917(0.05%)#194 |
| 2. | Lincoln | 348 | 1,687(20.63%)#2 | 944,917(0.04%)#340 |
| 3. | Bellevue | 181 | 1,687(10.73%)#3 | 944,917(0.02%)#772 |
| 4. | Falls City | 45 | 1,687(2.67%)#4 | 944,917(0.00%)#2,744 |
| 5. | Wayne | 40 | 1,687(2.37%)#5 | 944,917(0.00%)#2,948 |
| 6. | Offutt Afb | 25 | 1,687(1.48%)#6 | 944,917(0.00%)#3,861 |
| 7. | Plattsmouth | 22 | 1,687(1.30%)#7 | 944,917(0.00%)#4,130 |
| 8. | Ogallala | 22 | 1,687(1.30%)#8 | 944,917(0.00%)#4,140 |
| 9. | Alliance | 21 | 1,687(1.24%)#9 | 944,917(0.00%)#4,205 |
| 10. | O Neill | 17 | 1,687(1.01%)#10 | 944,917(0.00%)#4,694 |
| 11. | Central City | 17 | 1,687(1.01%)#11 | 944,917(0.00%)#4,702 |
| 12. | Blair | 15 | 1,687(0.89%)#12 | 944,917(0.00%)#4,916 |
| 13. | Mccook | 15 | 1,687(0.89%)#13 | 944,917(0.00%)#4,918 |
| 14. | Fremont | 13 | 1,687(0.77%)#14 | 944,917(0.00%)#5,178 |
| 15. | York | 13 | 1,687(0.77%)#15 | 944,917(0.00%)#5,230 |
| 16. | Papillion | 12 | 1,687(0.71%)#16 | 944,917(0.00%)#5,347 |
| 17. | La Vista | 12 | 1,687(0.71%)#17 | 944,917(0.00%)#5,359 |
| 18. | Waverly | 11 | 1,687(0.65%)#18 | 944,917(0.00%)#5,623 |
| 19. | Hickman | 10 | 1,687(0.59%)#19 | 944,917(0.00%)#5,842 |
| 20. | Gering | 9 | 1,687(0.53%)#20 | 944,917(0.00%)#5,986 |
| 21. | Kearney | 8 | 1,687(0.47%)#21 | 944,917(0.00%)#6,151 |
| 22. | Cozad | 7 | 1,687(0.41%)#22 | 944,917(0.00%)#6,473 |
| 23. | Wilber | 7 | 1,687(0.41%)#23 | 944,917(0.00%)#6,527 |
| 24. | Weeping Water | 7 | 1,687(0.41%)#24 | 944,917(0.00%)#6,561 |
| 25. | Tekamah | 5 | 1,687(0.30%)#25 | 944,917(0.00%)#7,005 |
| 26. | Pawnee City | 5 | 1,687(0.30%)#26 | 944,917(0.00%)#7,052 |
| 27. | Bassett | 5 | 1,687(0.30%)#27 | 944,917(0.00%)#7,076 |
| 28. | Grand Island | 4 | 1,687(0.24%)#28 | 944,917(0.00%)#7,113 |
| 29. | North Platte | 4 | 1,687(0.24%)#29 | 944,917(0.00%)#7,119 |
| 30. | Albion | 4 | 1,687(0.24%)#30 | 944,917(0.00%)#7,230 |
| 31. | Coleridge | 4 | 1,687(0.24%)#31 | 944,917(0.00%)#7,316 |
| 32. | Gibbon | 3 | 1,687(0.18%)#32 | 944,917(0.00%)#7,464 |
| 33. | Grant | 3 | 1,687(0.18%)#33 | 944,917(0.00%)#7,520 |
| 34. | Arapahoe | 3 | 1,687(0.18%)#34 | 944,917(0.00%)#7,577 |
| 35. | Laurel | 3 | 1,687(0.18%)#35 | 944,917(0.00%)#7,579 |
| 36. | Waterloo | 3 | 1,687(0.18%)#36 | 944,917(0.00%)#7,581 |
| 37. | Blue Hill | 3 | 1,687(0.18%)#37 | 944,917(0.00%)#7,589 |
| 38. | Elsie | 3 | 1,687(0.18%)#38 | 944,917(0.00%)#7,706 |
| 39. | Tecumseh | 2 | 1,687(0.12%)#39 | 944,917(0.00%)#7,777 |
| 40. | Sutton | 2 | 1,687(0.12%)#40 | 944,917(0.00%)#7,814 |
| 41. | North Bend | 2 | 1,687(0.12%)#41 | 944,917(0.00%)#7,832 |
| 42. | Walthill | 2 | 1,687(0.12%)#42 | 944,917(0.00%)#7,882 |
| 43. | Curtis | 2 | 1,687(0.12%)#43 | 944,917(0.00%)#7,912 |
| 44. | Cedar Bluffs | 2 | 1,687(0.12%)#44 | 944,917(0.00%)#7,919 |
| 45. | Trenton | 2 | 1,687(0.12%)#45 | 944,917(0.00%)#8,008 |
| 46. | Brady | 2 | 1,687(0.12%)#46 | 944,917(0.00%)#8,010 |
| 47. | Petersburg | 2 | 1,687(0.12%)#47 | 944,917(0.00%)#8,012 |
| 48. | Rising City | 2 | 1,687(0.12%)#48 | 944,917(0.00%)#8,043 |
| 49. | Bruning | 2 | 1,687(0.12%)#49 | 944,917(0.00%)#8,062 |
| 50. | Roseland | 2 | 1,687(0.12%)#50 | 944,917(0.00%)#8,067 |
| 51. | Du Bois | 2 | 1,687(0.12%)#51 | 944,917(0.00%)#8,101 |
| 52. | Hastings | 1 | 1,687(0.06%)#52 | 944,917(0.00%)#8,113 |
| 53. | Gordon | 1 | 1,687(0.06%)#53 | 944,917(0.00%)#8,155 |
| 54. | St Edward | 1 | 1,687(0.06%)#54 | 944,917(0.00%)#8,203 |
| 55. | Stratton | 1 | 1,687(0.06%)#55 | 944,917(0.00%)#8,244 |
| 56. | Polk | 1 | 1,687(0.06%)#56 | 944,917(0.00%)#8,250 |
| 57. | Uehling | 1 | 1,687(0.06%)#57 | 944,917(0.00%)#8,263 |
| 58. | Upland | 1 | 1,687(0.06%)#58 | 944,917(0.00%)#8,309 |
| 59. | Harrisburg | 1 | 1,687(0.06%)#59 | 944,917(0.00%)#8,332 |
Common Questions
What are the Top 10 Cities with the Most Immigrants from Northern Europe in Nebraska?
Top 10 Cities with the Most Immigrants from Northern Europe in Nebraska are:
#1
518
#2
348
#3
181
#4
45
#5
40
#6
25
#7
22
#8
22
#9
21
#10
17
What city has the Most Immigrants from Northern Europe in Nebraska?
Omaha has the Most Immigrants from Northern Europe in Nebraska with 518.
What is the Total Immigrants from Northern Europe in the State of Nebraska?
Total Immigrants from Northern Europe in Nebraska is 1,687.
What is the Total Immigrants from Northern Europe in the United States?
Total Immigrants from Northern Europe in the United States is 944,917.