Cities with the Most Immigrants from Northern Europe in Nevada
RELATED REPORTS & OPTIONS
Northern Europe
Nevada
Compare Cities
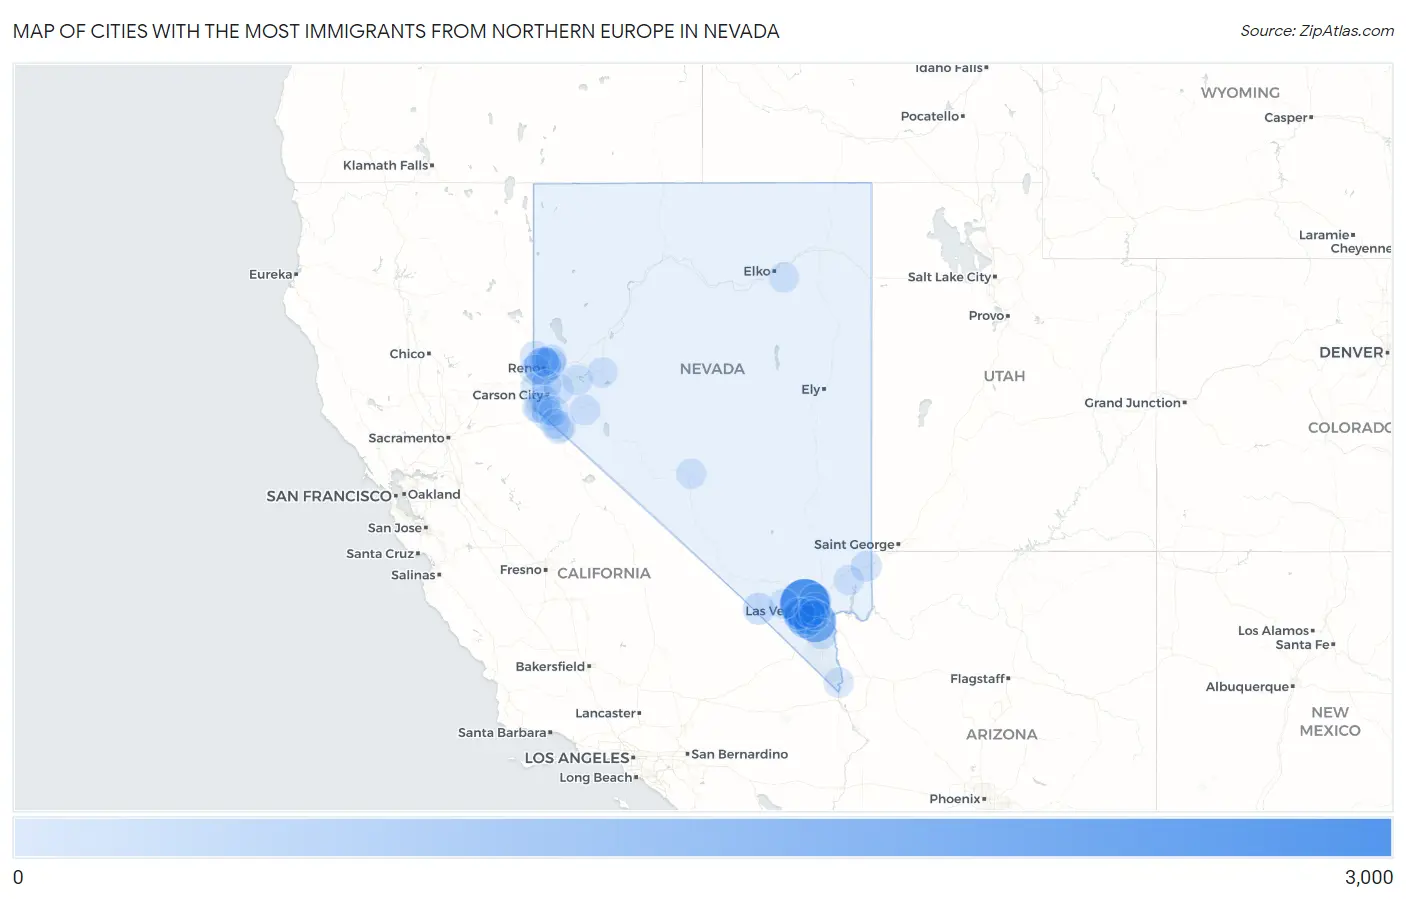
Map of Cities with the Most Immigrants from Northern Europe in Nevada
0
3,000
Cities with the Most Immigrants from Northern Europe in Nevada
| City | Northern Europe | vs State | vs National | |
| 1. | Las Vegas | 2,769 | 10,241(27.04%)#1 | 944,917(0.29%)#17 |
| 2. | Henderson | 1,654 | 10,241(16.15%)#2 | 944,917(0.18%)#35 |
| 3. | Reno | 946 | 10,241(9.24%)#3 | 944,917(0.10%)#89 |
| 4. | Spring Valley | 846 | 10,241(8.26%)#4 | 944,917(0.09%)#105 |
| 5. | Paradise | 636 | 10,241(6.21%)#5 | 944,917(0.07%)#159 |
| 6. | Enterprise | 500 | 10,241(4.88%)#6 | 944,917(0.05%)#202 |
| 7. | Sunrise Manor | 284 | 10,241(2.77%)#7 | 944,917(0.03%)#426 |
| 8. | Sparks | 278 | 10,241(2.71%)#8 | 944,917(0.03%)#446 |
| 9. | North Las Vegas | 276 | 10,241(2.70%)#9 | 944,917(0.03%)#453 |
| 10. | Summerlin South | 269 | 10,241(2.63%)#10 | 944,917(0.03%)#472 |
| 11. | Carson | 259 | 10,241(2.53%)#11 | 944,917(0.03%)#498 |
| 12. | Pahrump | 222 | 10,241(2.17%)#12 | 944,917(0.02%)#618 |
| 13. | Boulder City | 111 | 10,241(1.08%)#13 | 944,917(0.01%)#1,292 |
| 14. | Mesquite | 98 | 10,241(0.96%)#14 | 944,917(0.01%)#1,472 |
| 15. | Spanish Springs | 97 | 10,241(0.95%)#15 | 944,917(0.01%)#1,489 |
| 16. | Gardnerville Ranchos | 84 | 10,241(0.82%)#16 | 944,917(0.01%)#1,696 |
| 17. | Whitney | 71 | 10,241(0.69%)#17 | 944,917(0.01%)#1,912 |
| 18. | Winchester | 67 | 10,241(0.65%)#18 | 944,917(0.01%)#2,007 |
| 19. | Incline Village | 57 | 10,241(0.56%)#19 | 944,917(0.01%)#2,309 |
| 20. | Indian Hills | 54 | 10,241(0.53%)#20 | 944,917(0.01%)#2,410 |
| 21. | Silver Springs | 41 | 10,241(0.40%)#21 | 944,917(0.00%)#2,903 |
| 22. | Yerington | 34 | 10,241(0.33%)#22 | 944,917(0.00%)#3,273 |
| 23. | Cold Springs | 25 | 10,241(0.24%)#23 | 944,917(0.00%)#3,839 |
| 24. | Dayton | 23 | 10,241(0.22%)#24 | 944,917(0.00%)#4,002 |
| 25. | Verdi | 23 | 10,241(0.22%)#25 | 944,917(0.00%)#4,084 |
| 26. | Kingsbury | 22 | 10,241(0.21%)#26 | 944,917(0.00%)#4,164 |
| 27. | Spring Creek | 20 | 10,241(0.20%)#27 | 944,917(0.00%)#4,286 |
| 28. | Sun Valley | 19 | 10,241(0.19%)#28 | 944,917(0.00%)#4,391 |
| 29. | Moapa Valley | 14 | 10,241(0.14%)#29 | 944,917(0.00%)#5,075 |
| 30. | Washoe Valley | 14 | 10,241(0.14%)#30 | 944,917(0.00%)#5,117 |
| 31. | Fallon | 11 | 10,241(0.11%)#31 | 944,917(0.00%)#5,584 |
| 32. | Laughlin | 9 | 10,241(0.09%)#32 | 944,917(0.00%)#5,987 |
| 33. | Round Hill Village | 9 | 10,241(0.09%)#33 | 944,917(0.00%)#6,119 |
| 34. | Topaz Ranch Estates | 8 | 10,241(0.08%)#34 | 944,917(0.00%)#6,315 |
| 35. | Minden | 7 | 10,241(0.07%)#35 | 944,917(0.00%)#6,487 |
| 36. | Mount Charleston | 6 | 10,241(0.06%)#36 | 944,917(0.00%)#6,840 |
| 37. | Topaz Lake | 4 | 10,241(0.04%)#37 | 944,917(0.00%)#7,362 |
| 38. | Tonopah | 2 | 10,241(0.02%)#38 | 944,917(0.00%)#7,788 |
| 39. | Golden Valley | 2 | 10,241(0.02%)#39 | 944,917(0.00%)#7,843 |
| 40. | Fish Springs | 1 | 10,241(0.01%)#40 | 944,917(0.00%)#8,208 |
| 41. | Double Spring | 1 | 10,241(0.01%)#41 | 944,917(0.00%)#8,267 |
1
Common Questions
What are the Top 10 Cities with the Most Immigrants from Northern Europe in Nevada?
Top 10 Cities with the Most Immigrants from Northern Europe in Nevada are:
#1
2,769
#2
1,654
#3
946
#4
846
#5
636
#6
500
#7
284
#8
278
#9
276
#10
269
What city has the Most Immigrants from Northern Europe in Nevada?
Las Vegas has the Most Immigrants from Northern Europe in Nevada with 2,769.
What is the Total Immigrants from Northern Europe in the State of Nevada?
Total Immigrants from Northern Europe in Nevada is 10,241.
What is the Total Immigrants from Northern Europe in the United States?
Total Immigrants from Northern Europe in the United States is 944,917.