Cities with the Most Immigrants from Northern Europe in Ohio
RELATED REPORTS & OPTIONS
Northern Europe
Ohio
Compare Cities
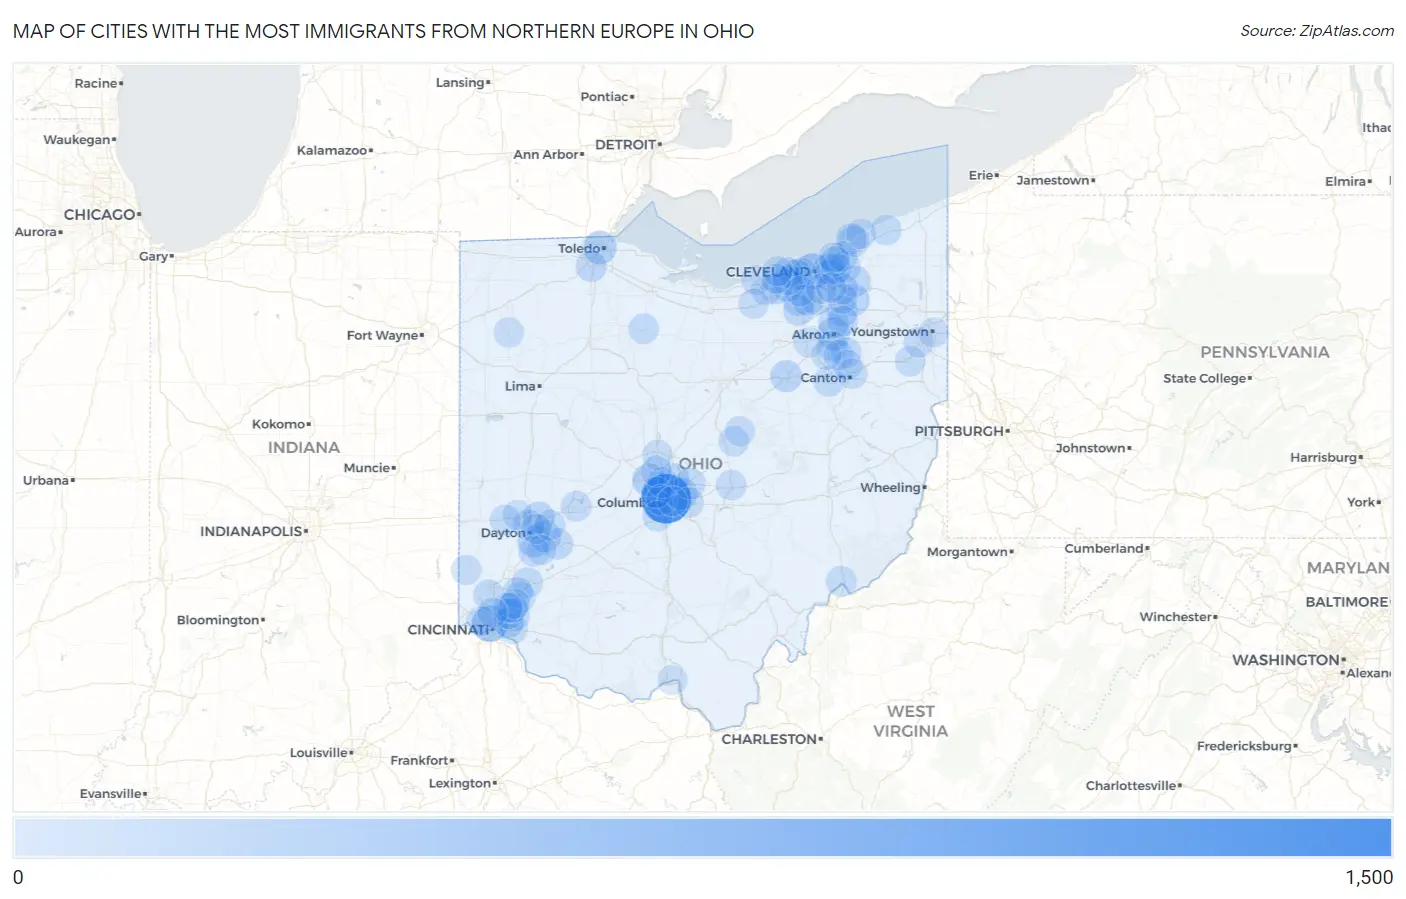
Map of Cities with the Most Immigrants from Northern Europe in Ohio
0
1,500
Cities with the Most Immigrants from Northern Europe in Ohio
| City | Northern Europe | vs State | vs National | |
| 1. | Columbus | 1,329 | 15,830(8.40%)#1 | 944,917(0.14%)#46 |
| 2. | Cincinnati | 435 | 15,830(2.75%)#2 | 944,917(0.05%)#243 |
| 3. | Cleveland | 407 | 15,830(2.57%)#3 | 944,917(0.04%)#275 |
| 4. | Toledo | 241 | 15,830(1.52%)#4 | 944,917(0.03%)#557 |
| 5. | Dublin | 211 | 15,830(1.33%)#5 | 944,917(0.02%)#660 |
| 6. | Akron | 210 | 15,830(1.33%)#6 | 944,917(0.02%)#662 |
| 7. | North Olmsted | 202 | 15,830(1.28%)#7 | 944,917(0.02%)#695 |
| 8. | Gahanna | 183 | 15,830(1.16%)#8 | 944,917(0.02%)#766 |
| 9. | Kettering | 175 | 15,830(1.11%)#9 | 944,917(0.02%)#791 |
| 10. | The Village Of Indian Hill | 164 | 15,830(1.04%)#10 | 944,917(0.02%)#863 |
| 11. | Wooster | 150 | 15,830(0.95%)#11 | 944,917(0.02%)#958 |
| 12. | Aurora | 150 | 15,830(0.95%)#12 | 944,917(0.02%)#960 |
| 13. | Lakewood | 147 | 15,830(0.93%)#13 | 944,917(0.02%)#978 |
| 14. | Beavercreek | 139 | 15,830(0.88%)#14 | 944,917(0.01%)#1,036 |
| 15. | Huber Heights | 137 | 15,830(0.87%)#15 | 944,917(0.01%)#1,050 |
| 16. | Strongsville | 135 | 15,830(0.85%)#16 | 944,917(0.01%)#1,068 |
| 17. | Shaker Heights | 122 | 15,830(0.77%)#17 | 944,917(0.01%)#1,180 |
| 18. | Hudson | 120 | 15,830(0.76%)#18 | 944,917(0.01%)#1,196 |
| 19. | Gates Mills | 120 | 15,830(0.76%)#19 | 944,917(0.01%)#1,205 |
| 20. | Cleveland Heights | 115 | 15,830(0.73%)#20 | 944,917(0.01%)#1,246 |
| 21. | Brunswick | 114 | 15,830(0.72%)#21 | 944,917(0.01%)#1,261 |
| 22. | Xenia | 114 | 15,830(0.72%)#22 | 944,917(0.01%)#1,263 |
| 23. | Rocky River | 113 | 15,830(0.71%)#23 | 944,917(0.01%)#1,272 |
| 24. | South Russell | 112 | 15,830(0.71%)#24 | 944,917(0.01%)#1,282 |
| 25. | North Ridgeville | 109 | 15,830(0.69%)#25 | 944,917(0.01%)#1,316 |
| 26. | North Royalton | 107 | 15,830(0.68%)#26 | 944,917(0.01%)#1,337 |
| 27. | Westerville | 105 | 15,830(0.66%)#27 | 944,917(0.01%)#1,366 |
| 28. | Mentor | 103 | 15,830(0.65%)#28 | 944,917(0.01%)#1,385 |
| 29. | Perrysburg | 102 | 15,830(0.64%)#29 | 944,917(0.01%)#1,405 |
| 30. | Solon | 102 | 15,830(0.64%)#30 | 944,917(0.01%)#1,406 |
| 31. | Upper Arlington | 99 | 15,830(0.63%)#31 | 944,917(0.01%)#1,455 |
| 32. | Dayton | 96 | 15,830(0.61%)#32 | 944,917(0.01%)#1,499 |
| 33. | New Albany | 92 | 15,830(0.58%)#33 | 944,917(0.01%)#1,577 |
| 34. | Cuyahoga Falls | 89 | 15,830(0.56%)#34 | 944,917(0.01%)#1,619 |
| 35. | Landen | 88 | 15,830(0.56%)#35 | 944,917(0.01%)#1,645 |
| 36. | Lyndhurst | 86 | 15,830(0.54%)#36 | 944,917(0.01%)#1,671 |
| 37. | Mentor On The Lake | 83 | 15,830(0.52%)#37 | 944,917(0.01%)#1,712 |
| 38. | Fairfield | 82 | 15,830(0.52%)#38 | 944,917(0.01%)#1,715 |
| 39. | Lebanon | 81 | 15,830(0.51%)#39 | 944,917(0.01%)#1,733 |
| 40. | Uniontown | 80 | 15,830(0.51%)#40 | 944,917(0.01%)#1,758 |
| 41. | Massillon | 79 | 15,830(0.50%)#41 | 944,917(0.01%)#1,764 |
| 42. | Centerville | 77 | 15,830(0.49%)#42 | 944,917(0.01%)#1,804 |
| 43. | Broadview Heights | 76 | 15,830(0.48%)#43 | 944,917(0.01%)#1,823 |
| 44. | Worthington | 76 | 15,830(0.48%)#44 | 944,917(0.01%)#1,825 |
| 45. | Westlake | 74 | 15,830(0.47%)#45 | 944,917(0.01%)#1,849 |
| 46. | Euclid | 72 | 15,830(0.45%)#46 | 944,917(0.01%)#1,890 |
| 47. | Springfield | 71 | 15,830(0.45%)#47 | 944,917(0.01%)#1,910 |
| 48. | Grandview Heights | 71 | 15,830(0.45%)#48 | 944,917(0.01%)#1,925 |
| 49. | Mason | 70 | 15,830(0.44%)#49 | 944,917(0.01%)#1,939 |
| 50. | Fairborn | 69 | 15,830(0.44%)#50 | 944,917(0.01%)#1,961 |
| 51. | Stow | 69 | 15,830(0.44%)#51 | 944,917(0.01%)#1,962 |
| 52. | Dry Run | 69 | 15,830(0.44%)#52 | 944,917(0.01%)#1,972 |
| 53. | Tiffin | 68 | 15,830(0.43%)#53 | 944,917(0.01%)#1,992 |
| 54. | Bay Village | 68 | 15,830(0.43%)#54 | 944,917(0.01%)#1,993 |
| 55. | Newark | 66 | 15,830(0.42%)#55 | 944,917(0.01%)#2,024 |
| 56. | Mariemont | 65 | 15,830(0.41%)#56 | 944,917(0.01%)#2,067 |
| 57. | Grove City | 63 | 15,830(0.40%)#57 | 944,917(0.01%)#2,096 |
| 58. | Powell | 63 | 15,830(0.40%)#58 | 944,917(0.01%)#2,107 |
| 59. | Kenwood | 63 | 15,830(0.40%)#59 | 944,917(0.01%)#2,119 |
| 60. | Montgomery | 62 | 15,830(0.39%)#60 | 944,917(0.01%)#2,143 |
| 61. | Marietta | 58 | 15,830(0.37%)#61 | 944,917(0.01%)#2,270 |
| 62. | Brookville | 58 | 15,830(0.37%)#62 | 944,917(0.01%)#2,272 |
| 63. | Madison | 57 | 15,830(0.36%)#63 | 944,917(0.01%)#2,316 |
| 64. | Gambier | 57 | 15,830(0.36%)#64 | 944,917(0.01%)#2,321 |
| 65. | Salem | 56 | 15,830(0.35%)#65 | 944,917(0.01%)#2,334 |
| 66. | Portage Lakes | 56 | 15,830(0.35%)#66 | 944,917(0.01%)#2,338 |
| 67. | Elyria | 55 | 15,830(0.35%)#67 | 944,917(0.01%)#2,352 |
| 68. | Canton | 53 | 15,830(0.33%)#68 | 944,917(0.01%)#2,419 |
| 69. | Willoughby Hills | 53 | 15,830(0.33%)#69 | 944,917(0.01%)#2,440 |
| 70. | Wadsworth | 52 | 15,830(0.33%)#70 | 944,917(0.01%)#2,459 |
| 71. | Delaware | 49 | 15,830(0.31%)#71 | 944,917(0.01%)#2,571 |
| 72. | Riverside | 47 | 15,830(0.30%)#72 | 944,917(0.00%)#2,646 |
| 73. | Canfield | 47 | 15,830(0.30%)#73 | 944,917(0.00%)#2,659 |
| 74. | Green | 46 | 15,830(0.29%)#74 | 944,917(0.00%)#2,683 |
| 75. | Richmond Heights | 43 | 15,830(0.27%)#75 | 944,917(0.00%)#2,818 |
| 76. | Reynoldsburg | 42 | 15,830(0.27%)#76 | 944,917(0.00%)#2,840 |
| 77. | Middleburg Heights | 42 | 15,830(0.27%)#77 | 944,917(0.00%)#2,854 |
| 78. | Oakwood | 42 | 15,830(0.27%)#78 | 944,917(0.00%)#2,867 |
| 79. | Lorain | 41 | 15,830(0.26%)#79 | 944,917(0.00%)#2,883 |
| 80. | Apple Valley | 41 | 15,830(0.26%)#80 | 944,917(0.00%)#2,902 |
| 81. | Oberlin | 40 | 15,830(0.25%)#81 | 944,917(0.00%)#2,943 |
| 82. | Sixteen Mile Stand | 40 | 15,830(0.25%)#82 | 944,917(0.00%)#2,951 |
| 83. | Avon | 39 | 15,830(0.25%)#83 | 944,917(0.00%)#2,972 |
| 84. | Oxford | 39 | 15,830(0.25%)#84 | 944,917(0.00%)#2,974 |
| 85. | Cheviot | 39 | 15,830(0.25%)#85 | 944,917(0.00%)#2,983 |
| 86. | Twinsburg | 38 | 15,830(0.24%)#86 | 944,917(0.00%)#3,023 |
| 87. | Blue Ash | 38 | 15,830(0.24%)#87 | 944,917(0.00%)#3,032 |
| 88. | Sharon Center | 38 | 15,830(0.24%)#88 | 944,917(0.00%)#3,057 |
| 89. | Independence | 37 | 15,830(0.23%)#89 | 944,917(0.00%)#3,085 |
| 90. | Fairport Harbor | 37 | 15,830(0.23%)#90 | 944,917(0.00%)#3,105 |
| 91. | North Canton | 36 | 15,830(0.23%)#91 | 944,917(0.00%)#3,136 |
| 92. | Finneytown | 35 | 15,830(0.22%)#92 | 944,917(0.00%)#3,182 |
| 93. | Avon Lake | 34 | 15,830(0.21%)#93 | 944,917(0.00%)#3,222 |
| 94. | Clayton | 34 | 15,830(0.21%)#94 | 944,917(0.00%)#3,237 |
| 95. | Bedford | 34 | 15,830(0.21%)#95 | 944,917(0.00%)#3,239 |
| 96. | Youngstown | 33 | 15,830(0.21%)#96 | 944,917(0.00%)#3,283 |
| 97. | Portsmouth | 33 | 15,830(0.21%)#97 | 944,917(0.00%)#3,301 |
| 98. | New Franklin | 33 | 15,830(0.21%)#98 | 944,917(0.00%)#3,309 |
| 99. | Bexley | 33 | 15,830(0.21%)#99 | 944,917(0.00%)#3,312 |
| 100. | Bellbrook | 33 | 15,830(0.21%)#100 | 944,917(0.00%)#3,324 |
Common Questions
What are the Top 10 Cities with the Most Immigrants from Northern Europe in Ohio?
Top 10 Cities with the Most Immigrants from Northern Europe in Ohio are:
#1
1,329
#2
435
#3
407
#4
241
#5
211
#6
210
#7
202
#8
183
#9
175
#10
164
What city has the Most Immigrants from Northern Europe in Ohio?
Columbus has the Most Immigrants from Northern Europe in Ohio with 1,329.
What is the Total Immigrants from Northern Europe in the State of Ohio?
Total Immigrants from Northern Europe in Ohio is 15,830.
What is the Total Immigrants from Northern Europe in the United States?
Total Immigrants from Northern Europe in the United States is 944,917.