Cities with the Most Immigrants from Northern Europe in Connecticut
RELATED REPORTS & OPTIONS
Northern Europe
Connecticut
Compare Cities
Map of Cities with the Most Immigrants from Northern Europe in Connecticut
0
1,500
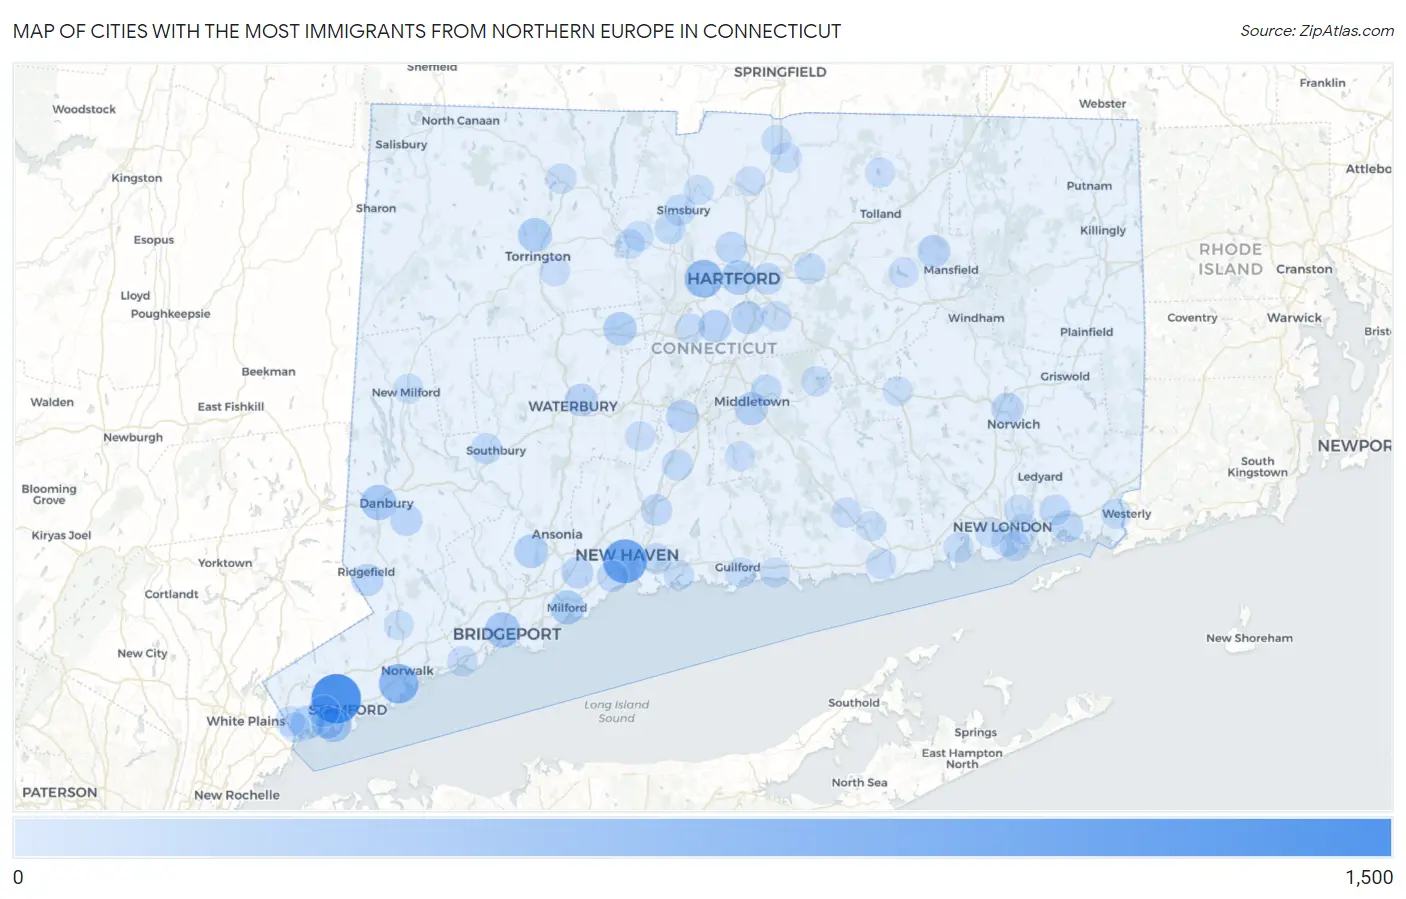
Cities with the Most Immigrants from Northern Europe in Connecticut
| City | Northern Europe | vs State | vs National | |
| 1. | Stamford | 1,212 | 20,043(6.05%)#1 | 944,917(0.13%)#58 |
| 2. | New Haven | 852 | 20,043(4.25%)#2 | 944,917(0.09%)#103 |
| 3. | Norwalk | 580 | 20,043(2.89%)#3 | 944,917(0.06%)#177 |
| 4. | West Hartford | 482 | 20,043(2.40%)#4 | 944,917(0.05%)#206 |
| 5. | Bridgeport | 333 | 20,043(1.66%)#5 | 944,917(0.04%)#355 |
| 6. | Danbury | 323 | 20,043(1.61%)#6 | 944,917(0.03%)#365 |
| 7. | Hartford | 292 | 20,043(1.46%)#7 | 944,917(0.03%)#412 |
| 8. | Staples | 269 | 20,043(1.34%)#8 | 944,917(0.03%)#474 |
| 9. | Old Greenwich | 266 | 20,043(1.33%)#9 | 944,917(0.03%)#484 |
| 10. | Milford City Balance | 254 | 20,043(1.27%)#10 | 944,917(0.03%)#506 |
| 11. | Torrington | 244 | 20,043(1.22%)#11 | 944,917(0.03%)#548 |
| 12. | Greenwich | 231 | 20,043(1.15%)#12 | 944,917(0.02%)#594 |
| 13. | Bristol | 223 | 20,043(1.11%)#13 | 944,917(0.02%)#614 |
| 14. | Shelton | 219 | 20,043(1.09%)#14 | 944,917(0.02%)#635 |
| 15. | Middletown | 189 | 20,043(0.94%)#15 | 944,917(0.02%)#739 |
| 16. | Riverside | 183 | 20,043(0.91%)#16 | 944,917(0.02%)#769 |
| 17. | Wethersfield | 181 | 20,043(0.90%)#17 | 944,917(0.02%)#774 |
| 18. | Noroton | 181 | 20,043(0.90%)#18 | 944,917(0.02%)#777 |
| 19. | Storrs | 170 | 20,043(0.85%)#19 | 944,917(0.02%)#822 |
| 20. | Waterbury | 169 | 20,043(0.84%)#20 | 944,917(0.02%)#825 |
| 21. | Meriden | 168 | 20,043(0.84%)#21 | 944,917(0.02%)#833 |
| 22. | Newington | 165 | 20,043(0.82%)#22 | 944,917(0.02%)#851 |
| 23. | Ridgefield | 148 | 20,043(0.74%)#23 | 944,917(0.02%)#975 |
| 24. | Coleytown | 141 | 20,043(0.70%)#24 | 944,917(0.01%)#1,025 |
| 25. | Norwich | 136 | 20,043(0.68%)#25 | 944,917(0.01%)#1,062 |
| 26. | New Canaan | 129 | 20,043(0.64%)#26 | 944,917(0.01%)#1,123 |
| 27. | Cos Cob | 125 | 20,043(0.62%)#27 | 944,917(0.01%)#1,158 |
| 28. | Bethel | 119 | 20,043(0.59%)#28 | 944,917(0.01%)#1,212 |
| 29. | Orange | 116 | 20,043(0.58%)#29 | 944,917(0.01%)#1,234 |
| 30. | Trumbull Center | 113 | 20,043(0.56%)#30 | 944,917(0.01%)#1,275 |
| 31. | Compo | 111 | 20,043(0.55%)#31 | 944,917(0.01%)#1,299 |
| 32. | North Haven | 109 | 20,043(0.54%)#32 | 944,917(0.01%)#1,318 |
| 33. | Mystic | 108 | 20,043(0.54%)#33 | 944,917(0.01%)#1,332 |
| 34. | Blue Hills | 105 | 20,043(0.52%)#34 | 944,917(0.01%)#1,372 |
| 35. | Saugatuck | 102 | 20,043(0.51%)#35 | 944,917(0.01%)#1,417 |
| 36. | East Hartford | 99 | 20,043(0.49%)#36 | 944,917(0.01%)#1,452 |
| 37. | West Haven | 95 | 20,043(0.47%)#37 | 944,917(0.01%)#1,520 |
| 38. | Old Hill | 92 | 20,043(0.46%)#38 | 944,917(0.01%)#1,580 |
| 39. | Wallingford Center | 90 | 20,043(0.45%)#39 | 944,917(0.01%)#1,608 |
| 40. | Greens Farms | 89 | 20,043(0.44%)#40 | 944,917(0.01%)#1,631 |
| 41. | East Haven | 85 | 20,043(0.42%)#41 | 944,917(0.01%)#1,679 |
| 42. | Simsbury Center | 81 | 20,043(0.40%)#42 | 944,917(0.01%)#1,743 |
| 43. | Weatogue | 81 | 20,043(0.40%)#43 | 944,917(0.01%)#1,745 |
| 44. | Heritage Village | 77 | 20,043(0.38%)#44 | 944,917(0.01%)#1,811 |
| 45. | Manchester | 71 | 20,043(0.35%)#45 | 944,917(0.01%)#1,913 |
| 46. | Old Mystic | 71 | 20,043(0.35%)#46 | 944,917(0.01%)#1,932 |
| 47. | Portland | 68 | 20,043(0.34%)#47 | 944,917(0.01%)#1,998 |
| 48. | Ridgebury | 61 | 20,043(0.30%)#48 | 944,917(0.01%)#2,194 |
| 49. | Pawcatuck | 56 | 20,043(0.28%)#49 | 944,917(0.01%)#2,339 |
| 50. | Candlewood Isle | 53 | 20,043(0.26%)#50 | 944,917(0.01%)#2,452 |
| 51. | Glastonbury Center | 50 | 20,043(0.25%)#51 | 944,917(0.01%)#2,556 |
| 52. | Winsted | 49 | 20,043(0.24%)#52 | 944,917(0.01%)#2,591 |
| 53. | Old Saybrook Center | 47 | 20,043(0.23%)#53 | 944,917(0.00%)#2,669 |
| 54. | Southwood Acres | 45 | 20,043(0.22%)#54 | 944,917(0.00%)#2,729 |
| 55. | New Britain | 44 | 20,043(0.22%)#55 | 944,917(0.00%)#2,754 |
| 56. | Southport | 44 | 20,043(0.22%)#56 | 944,917(0.00%)#2,792 |
| 57. | Branford Center | 39 | 20,043(0.19%)#57 | 944,917(0.00%)#2,992 |
| 58. | Naugatuck Borough | 38 | 20,043(0.19%)#58 | 944,917(0.00%)#3,014 |
| 59. | Sandy Hook | 38 | 20,043(0.19%)#59 | 944,917(0.00%)#3,041 |
| 60. | Quinnipiac University | 38 | 20,043(0.19%)#60 | 944,917(0.00%)#3,048 |
| 61. | Niantic | 38 | 20,043(0.19%)#61 | 944,917(0.00%)#3,052 |
| 62. | Long Hill | 37 | 20,043(0.18%)#62 | 944,917(0.00%)#3,097 |
| 63. | Oronoque | 37 | 20,043(0.18%)#63 | 944,917(0.00%)#3,099 |
| 64. | Poplar Plains | 36 | 20,043(0.18%)#64 | 944,917(0.00%)#3,165 |
| 65. | Lake Pocotopaug | 35 | 20,043(0.17%)#65 | 944,917(0.00%)#3,196 |
| 66. | New London | 34 | 20,043(0.17%)#66 | 944,917(0.00%)#3,218 |
| 67. | Groton | 34 | 20,043(0.17%)#67 | 944,917(0.00%)#3,248 |
| 68. | Tokeneke | 32 | 20,043(0.16%)#68 | 944,917(0.00%)#3,399 |
| 69. | Lordship | 30 | 20,043(0.15%)#69 | 944,917(0.00%)#3,511 |
| 70. | Woodmont Borough | 30 | 20,043(0.15%)#70 | 944,917(0.00%)#3,526 |
| 71. | Lakes East | 30 | 20,043(0.15%)#71 | 944,917(0.00%)#3,527 |
| 72. | Daniels Farm | 29 | 20,043(0.14%)#72 | 944,917(0.00%)#3,576 |
| 73. | Murray | 29 | 20,043(0.14%)#73 | 944,917(0.00%)#3,603 |
| 74. | Westport | 28 | 20,043(0.14%)#74 | 944,917(0.00%)#3,654 |
| 75. | Rock Ridge | 28 | 20,043(0.14%)#75 | 944,917(0.00%)#3,665 |
| 76. | New Milford | 25 | 20,043(0.12%)#76 | 944,917(0.00%)#3,854 |
| 77. | Waterford | 25 | 20,043(0.12%)#77 | 944,917(0.00%)#3,872 |
| 78. | Deep River Center | 25 | 20,043(0.12%)#78 | 944,917(0.00%)#3,876 |
| 79. | Conning Towers Nautilus Park | 24 | 20,043(0.12%)#79 | 944,917(0.00%)#3,926 |
| 80. | Durham | 24 | 20,043(0.12%)#80 | 944,917(0.00%)#3,953 |
| 81. | Essex Village | 24 | 20,043(0.12%)#81 | 944,917(0.00%)#3,960 |
| 82. | Madison Center | 24 | 20,043(0.12%)#82 | 944,917(0.00%)#3,971 |
| 83. | South Coventry | 24 | 20,043(0.12%)#83 | 944,917(0.00%)#3,972 |
| 84. | Cheshire Village | 23 | 20,043(0.11%)#84 | 944,917(0.00%)#4,037 |
| 85. | Tariffville | 23 | 20,043(0.11%)#85 | 944,917(0.00%)#4,075 |
| 86. | Route 7 Gateway | 22 | 20,043(0.11%)#86 | 944,917(0.00%)#4,169 |
| 87. | Glenville | 21 | 20,043(0.10%)#87 | 944,917(0.00%)#4,234 |
| 88. | Canton Valley | 21 | 20,043(0.10%)#88 | 944,917(0.00%)#4,253 |
| 89. | Windsor Locks | 20 | 20,043(0.10%)#89 | 944,917(0.00%)#4,290 |
| 90. | Guilford Center | 20 | 20,043(0.10%)#90 | 944,917(0.00%)#4,356 |
| 91. | Thompsonville | 18 | 20,043(0.09%)#91 | 944,917(0.00%)#4,529 |
| 92. | Tashua | 18 | 20,043(0.09%)#92 | 944,917(0.00%)#4,569 |
| 93. | Chimney Point | 18 | 20,043(0.09%)#93 | 944,917(0.00%)#4,615 |
| 94. | Colchester | 17 | 20,043(0.08%)#94 | 944,917(0.00%)#4,676 |
| 95. | Stonington Borough | 17 | 20,043(0.08%)#95 | 944,917(0.00%)#4,729 |
| 96. | Northwest Harwinton | 16 | 20,043(0.08%)#96 | 944,917(0.00%)#4,812 |
| 97. | Crystal Lake | 15 | 20,043(0.07%)#97 | 944,917(0.00%)#4,982 |
| 98. | Wilton Center | 15 | 20,043(0.07%)#98 | 944,917(0.00%)#4,992 |
| 99. | Collinsville | 14 | 20,043(0.07%)#99 | 944,917(0.00%)#5,107 |
| 100. | Pemberwick | 14 | 20,043(0.07%)#100 | 944,917(0.00%)#5,118 |
1
2Common Questions
What are the Top 10 Cities with the Most Immigrants from Northern Europe in Connecticut?
Top 10 Cities with the Most Immigrants from Northern Europe in Connecticut are:
#1
1,212
#2
852
#3
580
#4
482
#5
333
#6
323
#7
292
#8
266
#9
254
#10
244
What city has the Most Immigrants from Northern Europe in Connecticut?
Stamford has the Most Immigrants from Northern Europe in Connecticut with 1,212.
What is the Total Immigrants from Northern Europe in the State of Connecticut?
Total Immigrants from Northern Europe in Connecticut is 20,043.
What is the Total Immigrants from Northern Europe in the United States?
Total Immigrants from Northern Europe in the United States is 944,917.