Cities with the Most Immigrants from Japan in Pennsylvania
RELATED REPORTS & OPTIONS
Japan
Pennsylvania
Compare Cities
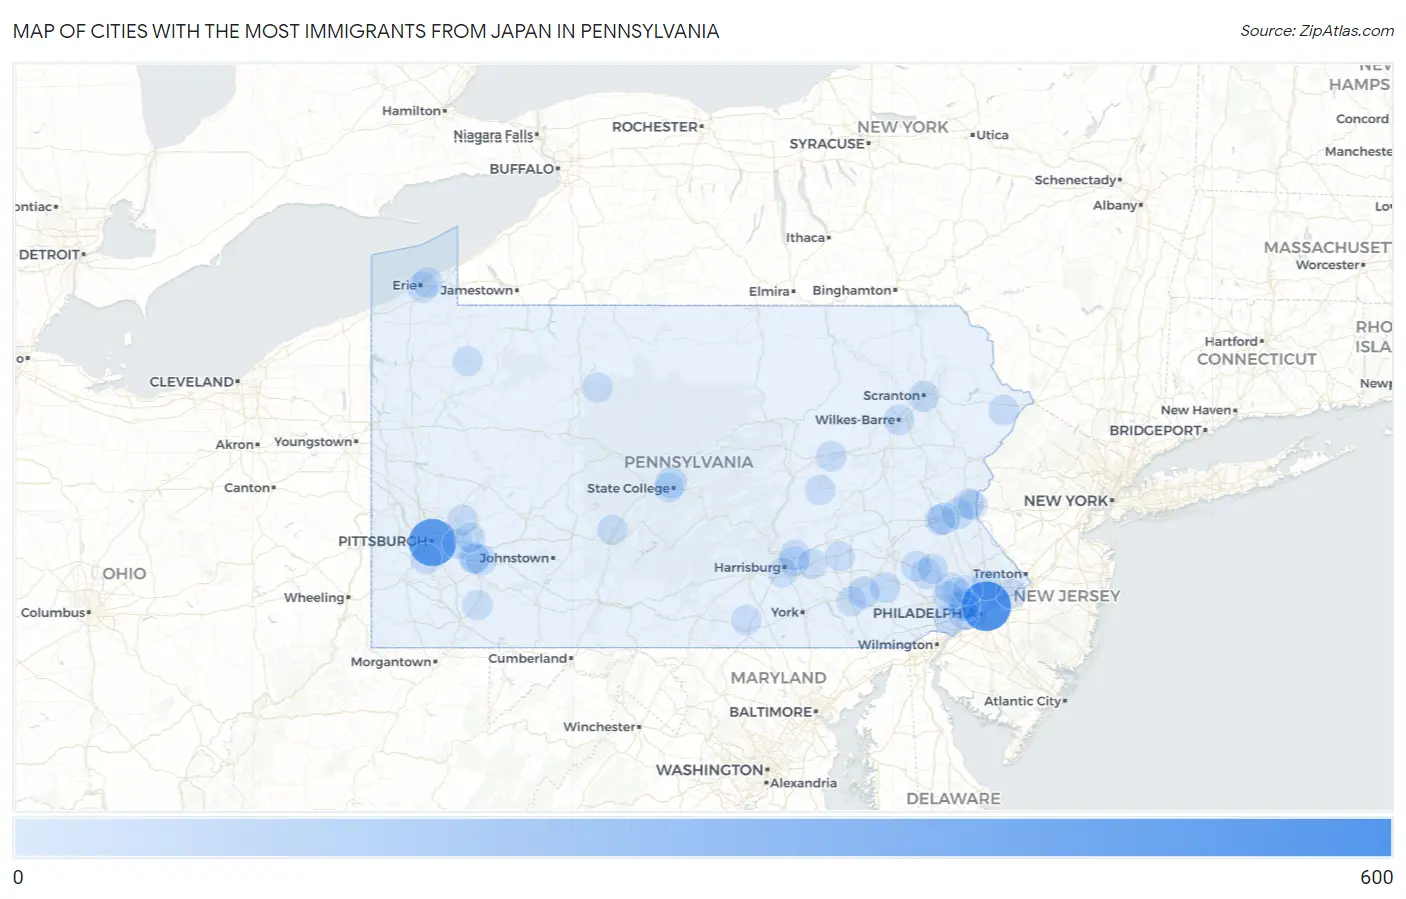
Map of Cities with the Most Immigrants from Japan in Pennsylvania
0
600
Cities with the Most Immigrants from Japan in Pennsylvania
| City | Japan | vs State | vs National | |
| 1. | Philadelphia | 524 | 4,648(11.27%)#1 | 342,380(0.15%)#84 |
| 2. | Pittsburgh | 463 | 4,648(9.96%)#2 | 342,380(0.14%)#101 |
| 3. | Carlisle Borough | 108 | 4,648(2.32%)#3 | 342,380(0.03%)#506 |
| 4. | Emmaus Borough | 106 | 4,648(2.28%)#4 | 342,380(0.03%)#514 |
| 5. | Aspinwall Borough | 94 | 4,648(2.02%)#5 | 342,380(0.03%)#571 |
| 6. | Franklin Park Borough | 46 | 4,648(0.99%)#6 | 342,380(0.01%)#1,015 |
| 7. | Leola | 46 | 4,648(0.99%)#7 | 342,380(0.01%)#1,019 |
| 8. | West Chester Borough | 44 | 4,648(0.95%)#8 | 342,380(0.01%)#1,045 |
| 9. | Allentown | 43 | 4,648(0.93%)#9 | 342,380(0.01%)#1,052 |
| 10. | Toftrees | 39 | 4,648(0.84%)#10 | 342,380(0.01%)#1,139 |
| 11. | Fountain Hill Borough | 37 | 4,648(0.80%)#11 | 342,380(0.01%)#1,188 |
| 12. | Bethlehem | 34 | 4,648(0.73%)#12 | 342,380(0.01%)#1,225 |
| 13. | Kingston Borough | 33 | 4,648(0.71%)#13 | 342,380(0.01%)#1,265 |
| 14. | Jeannette | 32 | 4,648(0.69%)#14 | 342,380(0.01%)#1,299 |
| 15. | Rosemont | 31 | 4,648(0.67%)#15 | 342,380(0.01%)#1,337 |
| 16. | Malvern Borough | 31 | 4,648(0.67%)#16 | 342,380(0.01%)#1,338 |
| 17. | Lansdowne Borough | 29 | 4,648(0.62%)#17 | 342,380(0.01%)#1,400 |
| 18. | Bala Cynwyd | 28 | 4,648(0.60%)#18 | 342,380(0.01%)#1,436 |
| 19. | Bryn Mawr | 27 | 4,648(0.58%)#19 | 342,380(0.01%)#1,464 |
| 20. | Goodville | 26 | 4,648(0.56%)#20 | 342,380(0.01%)#1,507 |
| 21. | Sinking Spring Borough | 23 | 4,648(0.49%)#21 | 342,380(0.01%)#1,626 |
| 22. | Scranton | 22 | 4,648(0.47%)#22 | 342,380(0.01%)#1,632 |
| 23. | Greensburg | 21 | 4,648(0.45%)#23 | 342,380(0.01%)#1,702 |
| 24. | Rochester Borough | 21 | 4,648(0.45%)#24 | 342,380(0.01%)#1,723 |
| 25. | Kenilworth | 21 | 4,648(0.45%)#25 | 342,380(0.01%)#1,729 |
| 26. | Erie | 20 | 4,648(0.43%)#26 | 342,380(0.01%)#1,735 |
| 27. | Amity Gardens | 20 | 4,648(0.43%)#27 | 342,380(0.01%)#1,778 |
| 28. | Wilkes Barre | 19 | 4,648(0.41%)#28 | 342,380(0.01%)#1,791 |
| 29. | Bethel Park | 18 | 4,648(0.39%)#29 | 342,380(0.01%)#1,842 |
| 30. | Linglestown | 18 | 4,648(0.39%)#30 | 342,380(0.01%)#1,872 |
| 31. | Drexel Hill | 17 | 4,648(0.37%)#31 | 342,380(0.00%)#1,905 |
| 32. | Dorneyville | 17 | 4,648(0.37%)#32 | 342,380(0.00%)#1,938 |
| 33. | Narberth Borough | 17 | 4,648(0.37%)#33 | 342,380(0.00%)#1,939 |
| 34. | Ardmore | 16 | 4,648(0.34%)#34 | 342,380(0.00%)#1,975 |
| 35. | Lower Burrell | 16 | 4,648(0.34%)#35 | 342,380(0.00%)#1,980 |
| 36. | Fernville | 16 | 4,648(0.34%)#36 | 342,380(0.00%)#2,012 |
| 37. | Hanover Borough | 15 | 4,648(0.32%)#37 | 342,380(0.00%)#2,045 |
| 38. | Dunmore Borough | 15 | 4,648(0.32%)#38 | 342,380(0.00%)#2,048 |
| 39. | Mount Joy Borough | 15 | 4,648(0.32%)#39 | 342,380(0.00%)#2,059 |
| 40. | Wayne | 15 | 4,648(0.32%)#40 | 342,380(0.00%)#2,065 |
| 41. | Palmer Heights | 14 | 4,648(0.30%)#41 | 342,380(0.00%)#2,144 |
| 42. | Lawrence Park | 14 | 4,648(0.30%)#42 | 342,380(0.00%)#2,147 |
| 43. | Sunrise Lake | 14 | 4,648(0.30%)#43 | 342,380(0.00%)#2,159 |
| 44. | Monroeville | 13 | 4,648(0.28%)#44 | 342,380(0.00%)#2,181 |
| 45. | Chambersburg Borough | 13 | 4,648(0.28%)#45 | 342,380(0.00%)#2,191 |
| 46. | Seven Fields Borough | 13 | 4,648(0.28%)#46 | 342,380(0.00%)#2,237 |
| 47. | Altoona | 12 | 4,648(0.26%)#47 | 342,380(0.00%)#2,265 |
| 48. | Fox Chapel Borough | 12 | 4,648(0.26%)#48 | 342,380(0.00%)#2,334 |
| 49. | Mahanoy City Borough | 12 | 4,648(0.26%)#49 | 342,380(0.00%)#2,341 |
| 50. | Fairview Ferndale | 12 | 4,648(0.26%)#50 | 342,380(0.00%)#2,354 |
| 51. | Langhorne Borough | 12 | 4,648(0.26%)#51 | 342,380(0.00%)#2,356 |
| 52. | Grapeville | 12 | 4,648(0.26%)#52 | 342,380(0.00%)#2,360 |
| 53. | St Marys | 11 | 4,648(0.24%)#53 | 342,380(0.00%)#2,398 |
| 54. | Audubon | 11 | 4,648(0.24%)#54 | 342,380(0.00%)#2,407 |
| 55. | Elkins Park | 11 | 4,648(0.24%)#55 | 342,380(0.00%)#2,417 |
| 56. | Jenkintown Borough | 11 | 4,648(0.24%)#56 | 342,380(0.00%)#2,427 |
| 57. | New Cumberland Borough | 10 | 4,648(0.22%)#57 | 342,380(0.00%)#2,520 |
| 58. | Pitcairn Borough | 10 | 4,648(0.22%)#58 | 342,380(0.00%)#2,550 |
| 59. | Lima | 10 | 4,648(0.22%)#59 | 342,380(0.00%)#2,552 |
| 60. | King Of Prussia | 9 | 4,648(0.19%)#60 | 342,380(0.00%)#2,584 |
| 61. | Murrysville | 9 | 4,648(0.19%)#61 | 342,380(0.00%)#2,590 |
| 62. | Croydon | 9 | 4,648(0.19%)#62 | 342,380(0.00%)#2,612 |
| 63. | Sanatoga | 9 | 4,648(0.19%)#63 | 342,380(0.00%)#2,618 |
| 64. | Oakmont Borough | 9 | 4,648(0.19%)#64 | 342,380(0.00%)#2,629 |
| 65. | York Springs Borough | 9 | 4,648(0.19%)#65 | 342,380(0.00%)#2,667 |
| 66. | Table Rock | 9 | 4,648(0.19%)#66 | 342,380(0.00%)#2,676 |
| 67. | Easton | 8 | 4,648(0.17%)#67 | 342,380(0.00%)#2,693 |
| 68. | Colonial Park | 8 | 4,648(0.17%)#68 | 342,380(0.00%)#2,708 |
| 69. | Connellsville | 8 | 4,648(0.17%)#69 | 342,380(0.00%)#2,728 |
| 70. | Scottdale Borough | 8 | 4,648(0.17%)#70 | 342,380(0.00%)#2,741 |
| 71. | Macungie Borough | 8 | 4,648(0.17%)#71 | 342,380(0.00%)#2,752 |
| 72. | Fredonia Borough | 8 | 4,648(0.17%)#72 | 342,380(0.00%)#2,779 |
| 73. | Lancaster | 7 | 4,648(0.15%)#73 | 342,380(0.00%)#2,788 |
| 74. | Munhall Borough | 7 | 4,648(0.15%)#74 | 342,380(0.00%)#2,829 |
| 75. | Villanova | 7 | 4,648(0.15%)#75 | 342,380(0.00%)#2,842 |
| 76. | Plymouth Borough | 7 | 4,648(0.15%)#76 | 342,380(0.00%)#2,855 |
| 77. | Chesterbrook | 7 | 4,648(0.15%)#77 | 342,380(0.00%)#2,857 |
| 78. | Delmont Borough | 7 | 4,648(0.15%)#78 | 342,380(0.00%)#2,880 |
| 79. | Mcadoo Borough | 7 | 4,648(0.15%)#79 | 342,380(0.00%)#2,882 |
| 80. | Clarks Green Borough | 7 | 4,648(0.15%)#80 | 342,380(0.00%)#2,890 |
| 81. | Hershey | 6 | 4,648(0.13%)#81 | 342,380(0.00%)#2,930 |
| 82. | Willow Grove | 6 | 4,648(0.13%)#82 | 342,380(0.00%)#2,932 |
| 83. | Camp Hill Borough | 6 | 4,648(0.13%)#83 | 342,380(0.00%)#2,951 |
| 84. | Orwigsburg Borough | 6 | 4,648(0.13%)#84 | 342,380(0.00%)#2,981 |
| 85. | Chester Heights Borough | 6 | 4,648(0.13%)#85 | 342,380(0.00%)#2,982 |
| 86. | Dormont Borough | 5 | 4,648(0.11%)#86 | 342,380(0.00%)#3,047 |
| 87. | Titusville | 5 | 4,648(0.11%)#87 | 342,380(0.00%)#3,054 |
| 88. | Red Hill Borough | 5 | 4,648(0.11%)#88 | 342,380(0.00%)#3,064 |
| 89. | Troy Borough | 5 | 4,648(0.11%)#89 | 342,380(0.00%)#3,089 |
| 90. | Hebron | 5 | 4,648(0.11%)#90 | 342,380(0.00%)#3,095 |
| 91. | Hopewell Borough | 5 | 4,648(0.11%)#91 | 342,380(0.00%)#3,118 |
| 92. | Lower Allen | 4 | 4,648(0.09%)#92 | 342,380(0.00%)#3,166 |
| 93. | Dallas Borough | 3 | 4,648(0.06%)#93 | 342,380(0.00%)#3,281 |
| 94. | West Kittanning Borough | 3 | 4,648(0.06%)#94 | 342,380(0.00%)#3,313 |
| 95. | Falls Creek Borough | 3 | 4,648(0.06%)#95 | 342,380(0.00%)#3,318 |
| 96. | Park Forest Village | 2 | 4,648(0.04%)#96 | 342,380(0.00%)#3,361 |
| 97. | Plymouth Meeting | 2 | 4,648(0.04%)#97 | 342,380(0.00%)#3,364 |
| 98. | Newtown Borough | 2 | 4,648(0.04%)#98 | 342,380(0.00%)#3,381 |
| 99. | South Coatesville Borough | 2 | 4,648(0.04%)#99 | 342,380(0.00%)#3,388 |
| 100. | Schwenksville Borough | 2 | 4,648(0.04%)#100 | 342,380(0.00%)#3,396 |
Common Questions
What are the Top 10 Cities with the Most Immigrants from Japan in Pennsylvania?
Top 10 Cities with the Most Immigrants from Japan in Pennsylvania are:
#1
524
#2
463
#3
46
#4
43
#5
39
#6
34
#7
32
#8
27
#9
26
#10
22
What city has the Most Immigrants from Japan in Pennsylvania?
Philadelphia has the Most Immigrants from Japan in Pennsylvania with 524.
What is the Total Immigrants from Japan in the State of Pennsylvania?
Total Immigrants from Japan in Pennsylvania is 4,648.
What is the Total Immigrants from Japan in the United States?
Total Immigrants from Japan in the United States is 342,380.